June 13, 2026 a 03:30 pm


EXPD: Dividend Analysis - Expeditors International of Washington, Inc.
Expeditors International of Washington, Inc. has maintained a robust dividend track record over the years, making it an attractive option for income-focused investors. With over three decades of consistent dividend payments and a prudent payout strategy, the firm displays a commitment to shareholder returns. Despite a relatively low dividend yield, its steady growth potential and strong financials provide solid long-term value.
📊 Overview
| Metric | Detail |
|---|---|
| Sector | Transportation |
| Dividend yield | 0.99% |
| Current dividend per share | 1.53 USD |
| Dividend history | 34 years |
| Last cut or suspension | None |
🗣️ Dividend History
The dividend history of a company provides crucial insights into management's commitment to return earnings to shareholders. With 34 consecutive years of dividend payments, Expeditors International of Washington, Inc. showcases a credible financial management ethos, appealing especially to long-term dividend-seeking investors.
| Year | Dividend per Share (USD) |
|---|---|
| 2026 | 0.81 |
| 2025 | 1.54 |
| 2024 | 1.46 |
| 2023 | 1.38 |
| 2022 | 1.34 |
📈 Dividend Growth
Analyzing dividend growth is essential for understanding a company’s potential to enhance shareholder value over time. Expeditors International of Washington, Inc. shows consistent growth, with noteworthy increments over 3- and 5-year periods, indicating a robust ability to increase payouts as the company's earnings grow.
| Time | Growth |
|---|---|
| 3 years | 4.75% |
| 5 years | 8.17% |
The average dividend growth is 8.17% over 5 years. This shows moderate but steady dividend growth.
📉 Payout Ratio
Payout ratios offer insights into the sustainability of dividends paid to shareholders. Expeditors International of Washington, Inc.’s ratios are healthy, with both EPS and free cash flow-based ratios comfortably below common thresholds, signifying that the bulk of earnings is being retained for future growth while rewarding shareholders.
| Key figure | Ratio |
|---|---|
| EPS-based | 24.38% |
| Free cash flow-based | 21.70% |
With a 24.38% EPS payout ratio and a 21.70% FCF payout ratio, the company is well-prepared to sustain its dividend in the event of earnings volatility.
✅ Cashflow & Capital Efficiency
Strong cash flow and capital efficiency metrics demonstrate a company's ability to effectively generate and reinvest earnings. Expeditors International of Washington, Inc. maintains excellent free cash flow yields and earnings yields, coupled with a prudent approach to capital expenditure, supporting stable dividend distributions.
| Year | 2023 | 2024 | 2025 |
|---|---|---|---|
| Free Cash Flow Yield | 5.34% | 4.37% | 4.71% |
| Earnings Yield | 3.97% | 5.19% | 4.02% |
| CAPEX to Operating Cash Flow | 3.73% | 5.59% | 5.28% |
| Stock-based Compensation to Revenue | 0.63% | 0.61% | 0.62% |
| Free Cash Flow / Operating Cash Flow Ratio | 96.27% | 94.41% | 94.72% |
The metrics indicate robust cash flow management practices and efficient capital allocation, reinforcing the company's capacity to sustain its dividend strategy.
🟢 Balance Sheet & Leverage Analysis
Analyzing the balance sheet and leverage provides insights into a company's financial health and ability to service its debt. Expeditors International’s conservative debt metrics and solid liquidity ratios affirm its strong financial standing, underscoring its resilience during economic downturns.
| Year | 2023 | 2024 | 2025 |
|---|---|---|---|
| Debt-to-Equity | 22.08% | 25.59% | 24.22% |
| Debt-to-Assets | 11.67% | 11.97% | 11.66% |
| Debt-to-Capital | 18.08% | 20.38% | 19.50% |
| Net Debt to EBITDA | -90.58% | -50.12% | -64.62% |
| Current Ratio | 201.55% | 177.10% | 181.19% |
| Quick Ratio | 201.55% | 177.10% | 181.19% |
| Financial Leverage | 189.25% | 213.87% | 207.74% |
The balance sheet strength and low leverage levels position the company well to manage obligations and pursue strategic growth opportunities.
🔵 Fundamental Strength & Profitability
Assessing a firm’s profitability and fundamental strength can provide deeper insights into its potential to generate returns. Positive metrics such as high returns on equity and assets indicate Expeditors International’s strong operational capabilities and return strategies.
| Year | 2023 | 2024 | 2025 |
|---|---|---|---|
| Return on Equity | 31.50% | 36.44% | 34.54% |
| Return on Assets | 16.64% | 17.04% | 16.63% |
| Margins: Net | 8.10% | 7.64% | 7.35% |
| Margins: EBIT | 10.97% | 10.33% | 9.88% |
| Margins: EBITDA | 11.69% | 10.90% | 10.40% |
| Margins: Gross | 13.39% | 12.73% | 15.31% |
| Research & Development to Revenue | 0% | 0% | 0% |
The profitability and efficient operations are solid, providing a formidable base for ongoing shareholder returns and strategic growth.
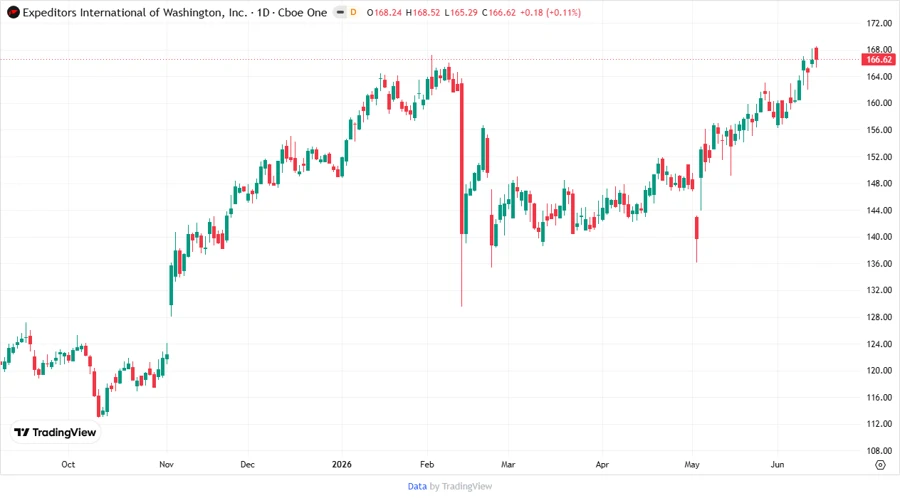
📈 Price Development
🔍 Dividend Scoring System
| Category | Score | Indicator |
|---|---|---|
| Dividend yield | 3 | |
| Dividend Stability | 5 | |
| Dividend growth | 4 | |
| Payout ratio | 5 | |
| Financial stability | 5 | |
| Dividend continuity | 5 | |
| Cashflow Coverage | 5 | |
| Balance Sheet Quality | 5 |
Total Score: 37/40
📊 Rating
With an impressive total score, Expeditors International of Washington, Inc. remains a formidable choice for dividend investors seeking stability with moderate growth potential. The company's robust financial structure, consistent historical performance, and prudent payout practices merit a buy recommendation for those focused on securing reliable income streams alongside solid capital appreciation prospects.
Smart Data Insight
Master the Perfect Entry & Exit for this Stock
Don't leave your profits to chance. Historically, this stock follows specific seasonal patterns that institutional traders use to maximize returns.
- ✅ Identify the "Golden Buying Window"
- ✅ Avoid high-risk correction cycles
- ✅ Backtested data from the last 20+ years