January 04, 2026 a 02:46 am


EXPD: Dividend Analysis - Expeditors International of Washington, Inc.
Expeditors International of Washington, Inc. (EXPD) is a leading player in the logistics sector, known for its robust dividend history and financial stability. This comprehensive analysis delves into its dividend profile, growth potential, and market positioning to provide a nuanced view of its investment value, particularly for income-focused investors. The company’s commitment to sustaining and growing its dividends is evident from its impressive track record and efficient capital management strategies.
📊 Overview
Expeditors is part of the logistics sector, with a solid dividend yield of 1.05%. The current dividend per share is $1.45. With a commendable history of 33 years without a dividend cut or suspension, it showcases consistent management and financial health.
| Sector | Dividend Yield (%) | Current Dividend Per Share (USD) | Dividend History (Years) | Last Cut or Suspension |
|---|---|---|---|---|
| Logistics | 1.05 | 1.45 | 33 | None |
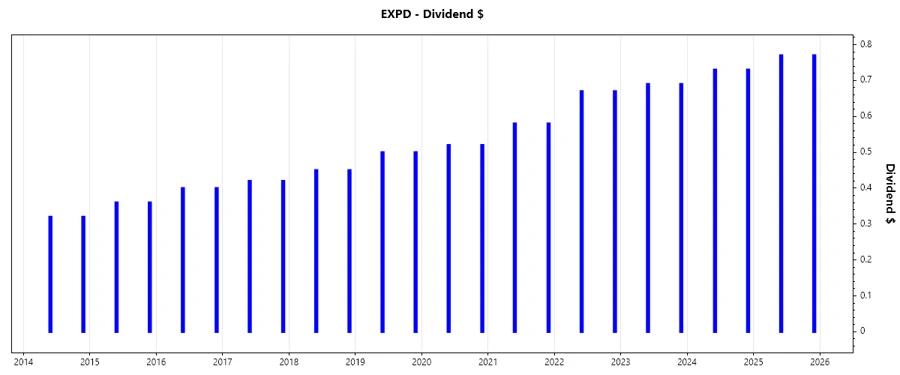
📉 Dividend History
The dividend history of Expeditors is a key indicator of its long-term stability and investor trust. Its consistent dividend payments for 33 years reflect a strong commitment to shareholder value. This durability is underscored by its performance during various economic conditions.
| Year | Dividend Per Share (USD) |
|---|---|
| 2025 | 1.54 |
| 2024 | 1.46 |
| 2023 | 1.38 |
| 2022 | 1.34 |
| 2021 | 1.16 |
📈 Dividend Growth
Dividend growth is a critical component for evaluating the future potential returns of a dividend-paying stock. Expeditors has demonstrated a dividend growth of 4.75% over the last three years and 8.17% over the past five years, indicating its strategic focus on enhancing shareholder returns while managing cost efficiencies.
| Timeframe | Growth (%) |
|---|---|
| 3 years | 4.75 |
| 5 years | 8.17 |
The average dividend growth is 8.17% over 5 years. This shows moderate but steady dividend growth, appealing to investors seeking reliable income enhancements.
✅ Payout Ratio
Payout ratios are essential for assessing a company’s ability to sustain dividend payments. The EPS-based payout ratio is 23.34%, while the FCF-based payout ratio stands at 21.51%. These figures suggest that Expeditors maintains a disciplined dividend payment policy, allowing for future growth and buffer against earnings volatility.
| Key Figure | Ratio (%) |
|---|---|
| EPS-based | 23.34 |
| Free Cash Flow-based | 21.51 |
The low payout ratios indicate a cautious approach, enabling Expeditors to invest in growth opportunities and mitigate potential financial risks.
💵 Cashflow & Capital Efficiency
The assessment of cash flow and capital efficiency reveals the firm's operational effectiveness and investment acumen. Analyzing metrics like FCF yield, earnings yield, and capital allocations demonstrates Expeditor’s strategic efficiency in utilizing its resources.
| 2024 | 2023 | 2022 | |
|---|---|---|---|
| Free Cash Flow Yield | 4.37% | 5.34% | 12.06% |
| Earnings Yield | 5.18% | 3.97% | 8.01% |
| CAPEX to Operating Cash Flow | 5.59% | 3.73% | 4.08% |
| Stock-based Compensation to Revenue | 0.61% | 0.63% | 0.38% |
| Free Cash Flow / Operating Cash Flow Ratio | 94.41% | 96.27% | 95.92% |
| Return on Invested Capital | 26.61% | 23.85% | 37.23% |
These figures indicate Expeditors efficiency in capital allocation, reflecting an ability to generate strong returns from its investments.
💼 Balance Sheet & Leverage Analysis
Analyzing the balance sheet and leverage ratios is pivotal for understanding the financial resilience and debt management of Expeditors.
| 2024 | 2023 | 2022 | |
|---|---|---|---|
| Debt-to-Equity | 0.256 | 0.221 | 0.167 |
| Debt-to-Assets | 0.120 | 0.117 | 0.093 |
| Debt-to-Capital | 0.204 | 0.181 | 0.143 |
| Net Debt to EBITDA | -0.53 | -0.98 | -0.81 |
| Current Ratio | 1.79 | 2.02 | 2.20 |
| Quick Ratio | 1.77 | 2.02 | 2.20 |
| Financial Leverage | 2.14 | 1.89 | 1.80 |
These balance sheet metrics point to a robust financial structure, with healthy liquidity levels and prudent leverage management.
🗣️ Fundamental Strength & Profitability
Expeditors demonstrates strong profitability metrics and an ability to sustain positive returns on equity and assets, reinforcing its operational excellence and competitive positioning.
| 2024 | 2023 | 2022 | |
|---|---|---|---|
| Return on Equity | 36.44% | 31.50% | 43.65% |
| Return on Assets | 17.04% | 16.64% | 24.28% |
| Net Margin | 7.64% | 8.10% | 7.95% |
| EBIT Margin | 9.82% | 10.11% | 10.69% |
These metrics highlight Expeditors' strategic capacity to maintain above-average returns and efficient cost management, vital for long-term growth sustainability.
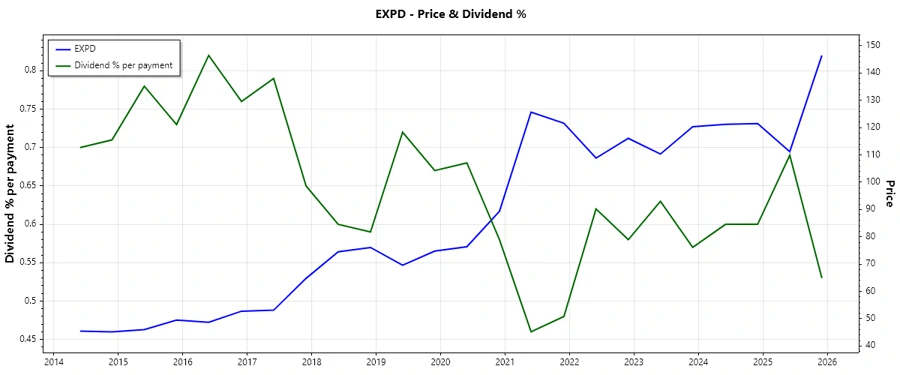
🏷️ Price Development
📊 Dividend Scoring System
| Evaluation Criteria | Score | |
|---|---|---|
| Dividend Yield | 2 | |
| Dividend Stability | 5 | |
| Dividend Growth | 4 | |
| Payout Ratio | 5 | |
| Financial Stability | 5 | |
| Dividend Continuity | 5 | |
| Cashflow Coverage | 4 | |
| Balance Sheet Quality | 5 |
Total Score: 35/40
📈 Rating
Expeditors International of Washington, Inc. demonstrates strong dividend reliability, underpinned by financial discipline and consistent growth. With impressive stability and efficient capital management, the stock is a robust selection for dividend investors seeking stable income with potential for capital appreciation. Recommended for investors aiming for a balanced long-term income strategy.