December 21, 2025 a 03:31 pm
EXPD: Dividend Analysis - Expeditors International of Washington, Inc.
Expeditors International of Washington, Inc., a leader in the logistics sector, demonstrates a strong dividend profile with a consistent history of payments over 33 years. The company's commitment to return value to shareholders is evident from its moderate yet steady dividend growth, stability, and solid payout ratios. With a respectable yield of approximately 1.05%, investors can anticipate ongoing income dividends.
📊 Overview
The logistics sector remains a cornerstone of global trade. Expeditors International's dividend yield of 1.05% indicates a reliable income stream for shareholders. The company currently provides a dividend per share of $1.45, with an impressive 33-year streak of unbroken payments, showcasing its commitment to dividend sustainability.
| Factor | Detail |
|---|---|
| Sector | Logistics |
| Dividend yield | 1.05% |
| Current dividend per share | $1.45 |
| Dividend history | 33 years |
| Last cut or suspension | None |
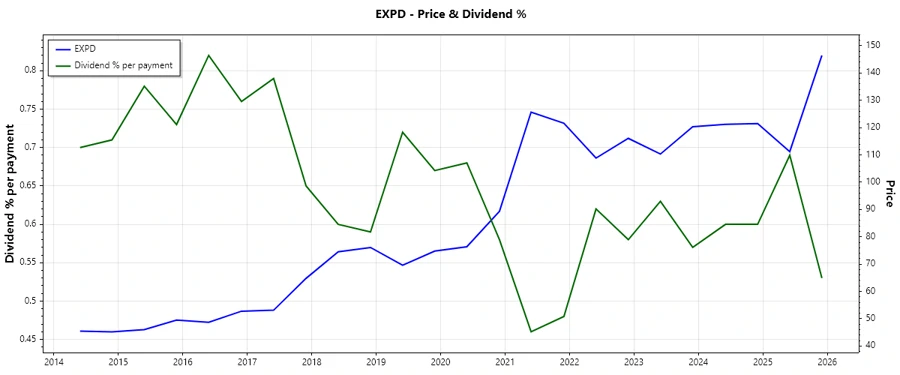
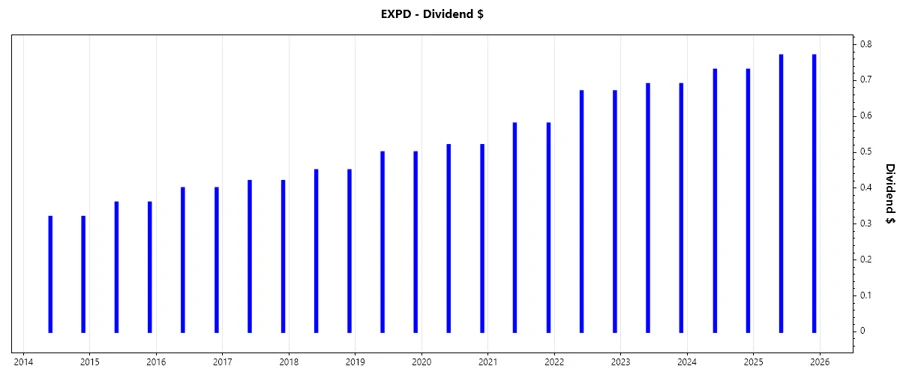
📈 Dividend History
Understanding dividend history is crucial for forecasting future dividend payment potential. A strong dividend history often indicates future stability and resilience in uncertain economic climates.
| Year | Dividend per Share (USD) |
|---|---|
| 2025 | $1.54 |
| 2024 | $1.46 |
| 2023 | $1.38 |
| 2022 | $1.34 |
| 2021 | $1.16 |
📉 Dividend Growth
Dividend growth is an indicator of a company's ambition and financial health. The ability to increase dividends signifies robust cash flows and confidence by management in future performance.
| Time | Growth |
|---|---|
| 3 years | 7.97% |
| 5 years | 7.86% |
The average dividend growth is 7.86% over 5 years. This shows moderate but steady dividend growth.
✅ Payout Ratio
Payout ratios offer insight into a company’s ability to sustain its dividend payments. A lower payout ratio suggests a safer dividend, providing more room for reinvestment in growth or increased dividend payments in the future.
| Key figure | Ratio |
|---|---|
| EPS-based | 23.34% |
| Free cash flow-based | 21.51% |
The payout ratio of 23.34% (EPS) and 21.51% (FCF) indicates a sustainable dividend with ample room for coverage, contributing positively to Expeditors International's dividend reliability.
🗣️ Cashflow & Capital Efficiency
Analyzing cash flow and capital efficiency metrics highlights how efficiently a company utilizes its cash to generate returns, an indicator of management effectiveness in resource allocation.
| Metric | 2024 | 2023 | 2022 |
|---|---|---|---|
| Free Cash Flow Yield | 4.37% | 5.34% | 12.06% |
| Earnings Yield | 5.19% | 3.97% | 8.01% |
| CAPEX to Operating Cash Flow | 5.16% | 3.73% | 4.08% |
| Stock-based Compensation to Revenue | 0.61% | 0.63% | 0.38% |
| Free Cash Flow / Operating Cash Flow Ratio | 94.41% | 96.27% | 95.92% |
The considerable free cash flow yield suggests Expeditors can efficiently generate cash relative to its valuation, underscoring a strong foundation for ongoing dividend distributions.
⚠️ Balance Sheet & Leverage Analysis
A robust balance sheet with manageable debt levels and sufficient liquidity signifies financial resilience and the ability to weather market fluctuations while preserving dividend payments.
| Metric | 2024 | 2023 | 2022 |
|---|---|---|---|
| Debt-to-Equity | 25.59% | 22.08% | 16.67% |
| Debt-to-Assets | 11.97% | 11.67% | 9.27% |
| Debt-to-Capital | 20.38% | 18.08% | 14.29% |
| Net Debt to EBITDA | -0.53 | -0.98 | -0.81 |
| Current Ratio | 1.77 | 2.02 | 2.20 |
| Quick Ratio | 1.77 | 2.02 | 2.20 |
| Financial Leverage | 2.14 | 1.89 | 1.80 |
The company's low debt-to-equity ratio and strong liquidity position indicate robust financial health, supporting further potential dividend increases.
📊 Fundamental Strength & Profitability
Profitability ratios reveal a company's ability to generate sufficient earnings and provide insights into its operational efficiency, which underpins dividend policy sustainability.
| Metric | 2024 | 2023 | 2022 |
|---|---|---|---|
| Return on Equity | 36.44% | 31.50% | 43.65% |
| Return on Assets | 17.04% | 16.64% | 24.28% |
| Net Margin | 7.64% | 8.10% | 7.95% |
| EBIT Margin | 9.82% | 10.11% | 10.69% |
| EBITDA Margin | 10.40% | 10.84% | 11.03% |
| Gross Margin | 12.73% | 13.39% | 12.72% |
| R&D to Revenue | 0% | 0% | 0% |
With high returns on equity and assets, Expeditors showcases solid profitability, substantiating its capacity to continue rewarding shareholders through dividends.
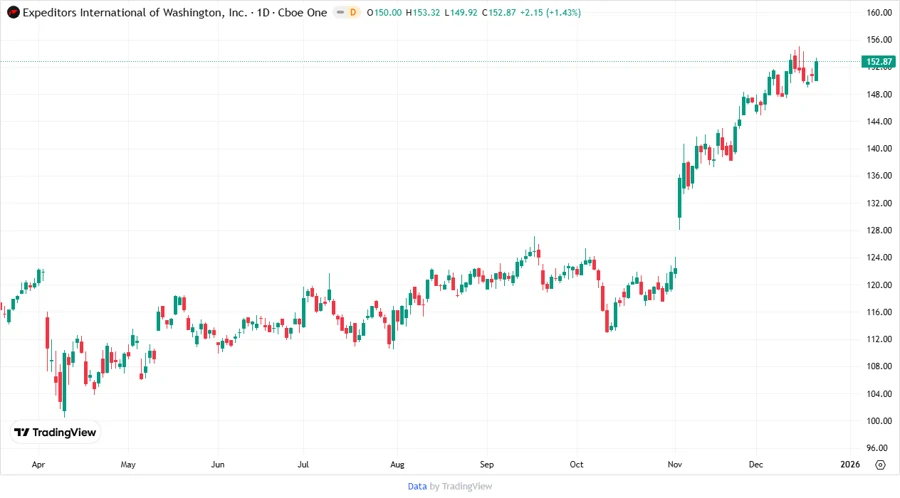
📈 Price Development
✅ Dividend Scoring System
| Criterion | Score | Bar |
|---|---|---|
| Dividend yield | 3 | |
| Dividend Stability | 5 | |
| Dividend growth | 4 | |
| Payout ratio | 5 | |
| Financial stability | 5 | |
| Dividend continuity | 5 | |
| Cashflow Coverage | 4 | |
| Balance Sheet Quality | 5 |
Total Score: 36 out of 40
🔍 Rating
Based on the comprehensive analysis, Expeditors International offers a compelling dividend profile with reliability and potential for continued growth. Its prudent payout ratios and robust financials position it as a formidable choice for dividend-oriented investors. The overall rating suggests a strong buy for those seeking stable income streams.