February 12, 2026 a 03:15 am
EXE: Trend and Support & Resistance Analysis - Expand Energy Corporation
Expand Energy Corporation, historically known as Chesapeake Energy Corporation, holds a robust portfolio of natural gas assets with substantial operations within the Marcellus and Haynesville Shales. Despite the complexities of energy markets, the current technical trends indicate movements that might present opportunities or risks to investors, based largely on historical price data and support/resistance zones.
Trend Analysis
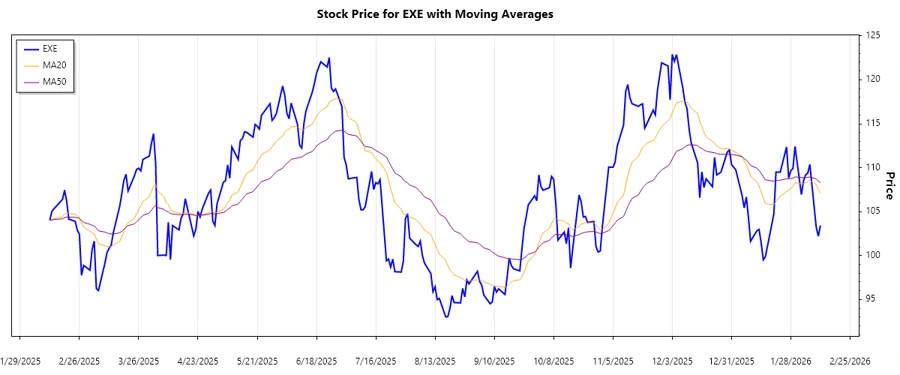
The analysis of the recent trend for Expand Energy Corp. (EXE) highlights a dominant technical direction. By calculating the Exponential Moving Averages (EMA) of the closing prices, the latest data suggests that:
| Date | Close Price | Trend |
|---|---|---|
| 2026-02-11 | 103.43 | ▼ |
| 2026-02-10 | 102.21 | ▼ |
| 2026-02-09 | 103.24 | ▼ |
| 2026-02-06 | 110.37 | ▲ |
| 2026-02-05 | 109.37 | ▲ |
| 2026-02-04 | 109.19 | ▲ |
| 2026-02-03 | 108.5 | ▲ |
The recent directional indicators reveal a short-term downtrend. The EMA20 crossed below the EMA50, suggesting bearish sentiment. Overall, rapid shifts in energy prices could dictate future directional changes.
Support and Resistance
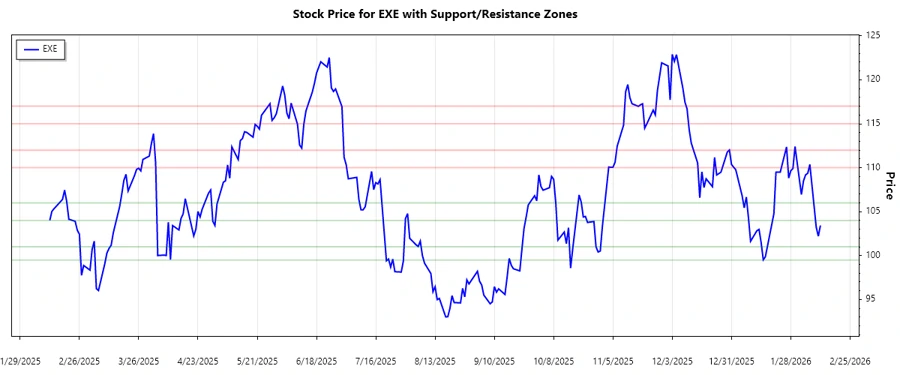
Using the closing prices, key support and resistance zones have been identified. These areas often represent psychological levels where traders might strategically enter or exit trades:
| Zone Type | From | To |
|---|---|---|
| Support 1 | 99.50 | 101.00 |
| Support 2 | 104.00 | 106.00 |
| Resistance 1 | 110.00 | 112.00 |
| Resistance 2 | 115.00 | 117.00 |
Currently, the price finds itself close to the first support zone, suggesting potential buying interest. Experience has shown these areas can presage significant reversals or continuations.
Conclusion
Expand Energy Corporation, despite recent adverse movements, might uncover new opportunities. The current downtrend coupled with critical support zones poses risks but also potential buying opportunities should momentum reverse. Generally, EXE remains a crucial watch for energy investors given its expansive portfolio in the US natural gas sector, albeit sensitive to broader market fluctuations.