July 11, 2025 a 08:15 am

EXC: Trend and Support & Resistance Analysis - Exelon Corporation
Exelon Corporation has shown volatile price movements over the past few months, reflective of its exposure to diverse energy markets and regulatory environments. The company is positioned uniquely with its renewable energy portfolio amidst increasing environmental regulations. However, fluctuating energy prices and geopolitical factors may influence its stock performance. This analysis provides insights on the recent trend moves, significant support levels, and potential resistance zones for EXC.
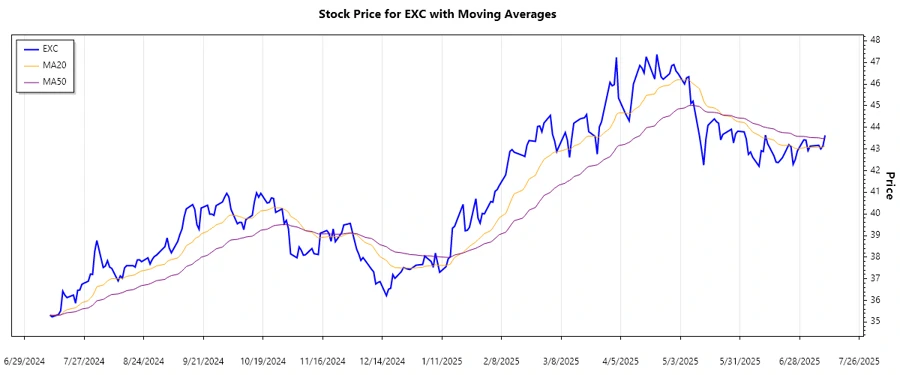
Trend Analysis
The Exelon Corporation (EXC) stock has experienced a gentle uptrend in the recent months based on daily closing prices. By calculating the EMA20 and EMA50, it was observed that the EMA20 is greater than EMA50, indicating an upward trend.
| Date | Closing Price | Trend |
|---|---|---|
| 2025-07-10 | $43.63 | ▲ Up |
| 2025-07-09 | $43.14 | ▲ Up |
| 2025-07-08 | $43.00 | ▲ Up |
| 2025-07-07 | $43.17 | ▲ Up |
| 2025-07-03 | $43.13 | ▲ Up |
| 2025-07-02 | $42.92 | ▲ Up |
| 2025-07-01 | $43.41 | ▲ Up |
The consistent position of EMA20 above EMA50 signals a continuation of the current uptrend, supported by favorable market conditions.
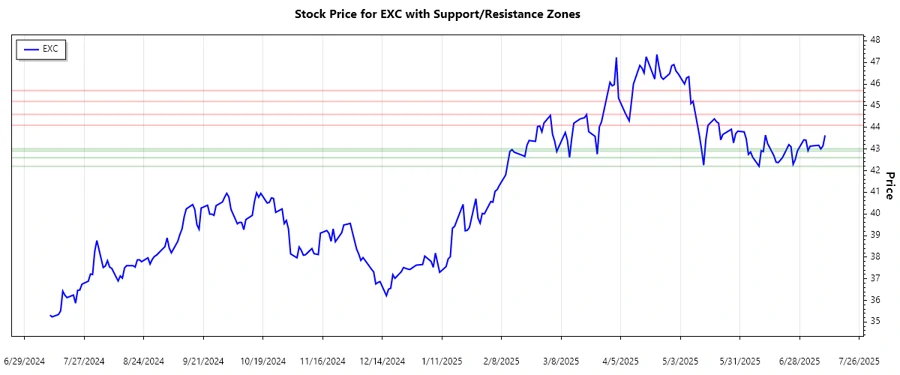
Support- and Resistance
Identifying key support and resistance zones helps in understanding potential reversal points or breakthrough levels. Based on the chart data, significant zones were calculated.
| Zone Type | Zone From | Zone To |
|---|---|---|
| Support 1 | $42.20 | $42.60 |
| Support 2 | $42.90 | $43.00 |
| Resistance 1 | $44.10 | $44.60 |
| Resistance 2 | $45.20 | $45.70 |
Currently, the EXC stock price is not within a critical support or resistance zone, suggesting neutrality pending a move towards a defined area.
Conclusion
The Exelon Corporation stock price demonstrates a steady upward trajectory, driven by favorable EMA indications. The current market environment supports its green energy tilt. Support and resistance analysis reveals potential price pivots requiring cautious market observation. Investors should weigh the current trend against broader economic shifts, regulatory impacts, and evolving geopolitical climates, which may introduce volatility. Technical insights suggest bullish momentum, yet caution is recommended upon approaching resistance levels.
Smart Data Insight
Master the Perfect Entry & Exit for this Stock
Don't leave your profits to chance. Historically, this stock follows specific seasonal patterns that institutional traders use to maximize returns.
- ✅ Identify the "Golden Buying Window"
- ✅ Avoid high-risk correction cycles
- ✅ Backtested data from the last 20+ years