March 08, 2026 a 06:44 am

EXC: Fibonacci Analysis - Exelon Corporation
Exelon Corporation, being a leading utility services holding company, boasts an extensive portfolio of energy generation and delivery. Observing the company's stock trends and applying Fibonacci analysis aids investors in understanding potential support and resistance levels. The analysis provides a critical lens for strategic positions, especially in a market characterized by economic fluctuations and energy demands.
Fibonacci Analysis
| Detail | Value |
|---|---|
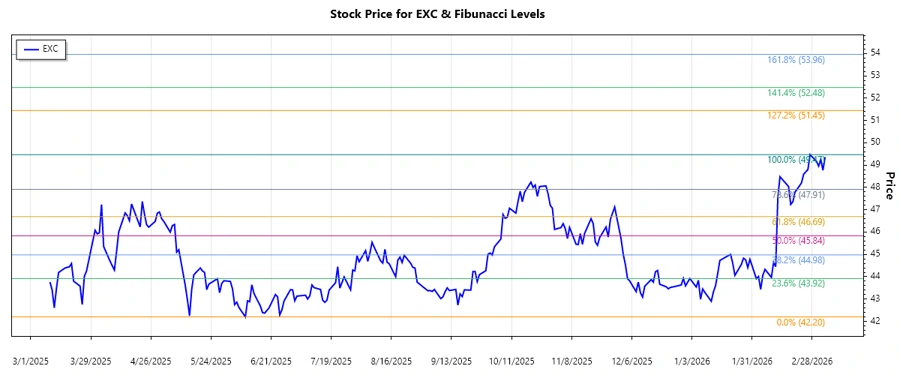
| Trend Start Date | 2025-12-15 |
| Trend End Date | 2026-03-06 |
| High Price and Date | $49.47 on 2026-02-27 |
| Low Price and Date | $42.2 on 2025-06-09 |
| Fibonacci 0.236 | $43.99 |
| Fibonacci 0.382 | $45.42 |
| Fibonacci 0.5 | $46.49 |
| Fibonacci 0.618 | $47.55 |
| Fibonacci 0.786 | $48.93 |
| Current Price Analysis | The current price is $49.36, near the resistance at $48.93 (Fibonacci 0.786). |
| Technical Interpretation | Price reaching 0.786 level suggests potential resistance. Watch for reversal or breakout. |
Conclusion
The Exelon Corporation stock exhibits a dominant uptrend facilitated by positive energy market dynamics. The stock is nearing Fibonacci resistance levels, indicating possible price consolidation or reversal. Analysts should closely monitor market entries or potential pullbacks as price approaches key Fibonacci levels. These levels can serve as strategic entry or exit points, providing insight into market strength and potential future trends. Additionally, Exelon's solid foundation in diverse energy segments offers resilience amidst market fluctuations. In summary, while current valuations are near resistance, the broader outlook remains promising with calculated vigilance.