January 27, 2026 a 07:46 am
EXC: Dividend Analysis - Exelon Corporation
Exelon Corporation exhibits a robust dividend history with a longstanding commitment to its shareholders, as evidenced by its 53 years of dividend history. The company maintains a competitive dividend yield of 3.52% and has not experienced a cut or suspension since 2014. This stability is likely to attract income-focused investors, although the negative free cash flow yield may raise caution among those concerned with sustainability.
📊 Overview
| Detail | Value |
|---|---|
| Sector | Utilities |
| Dividend Yield | 3.52 % |
| Current Dividend Per Share | 1.52 USD |
| Dividend History | 53 years |
| Last Cut or Suspension | 2014 |
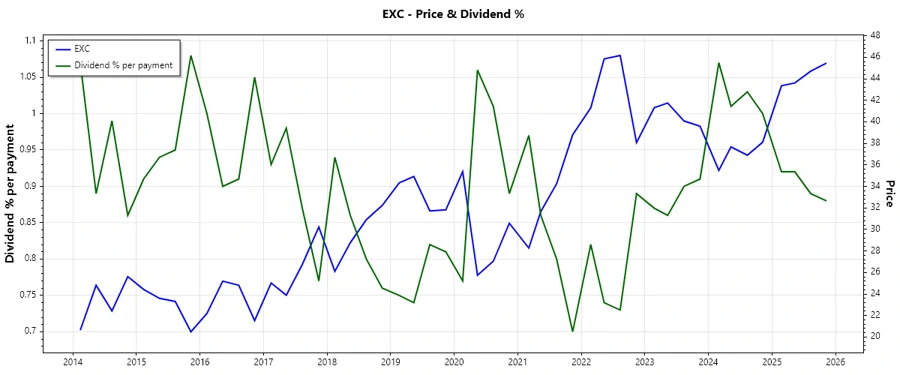
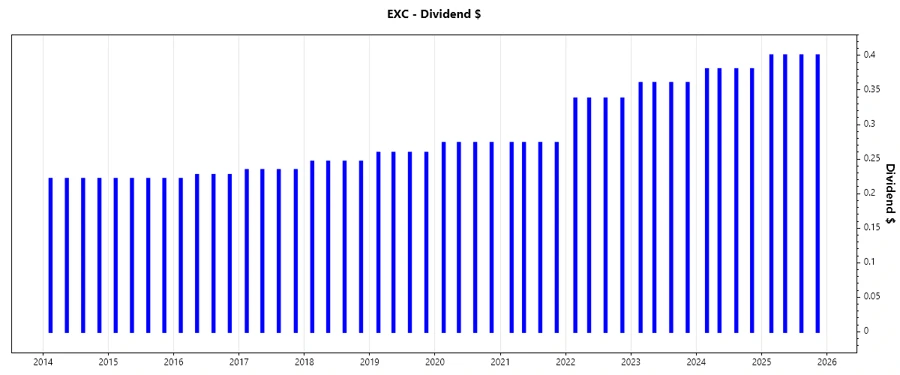
🗣️ Dividend History
The historical dividend record demonstrates Exelon's commitment to returning profits to shareholders. This consistency reflects a strong, stable company, yet prospective investors should consider the company's cash flow to evaluate future dividend sustainability.
| Year | Dividend per Share (USD) |
|---|---|
| 2025 | 1.60 |
| 2024 | 1.52 |
| 2023 | 1.44 |
| 2022 | 1.35 |
| 2021 | 1.09 |
📈 Dividend Growth
The dividend growth analysis provides insight into how the company's dividend has evolved, reflecting its financial health over time. This growth often indicates the company's ability to increase payouts sustainably.
| Time | Growth |
|---|---|
| 3 years | 5.83 % |
| 5 years | 7.93 % |
The average dividend growth is 7.93% over 5 years. This shows moderate but steady dividend growth.
✅ Payout Ratio
Understanding the payout ratio is crucial as it indicates how much earnings are distributed as dividends. A lower ratio suggests room for growth or resilience in economic downturns.
| Key Figure | Ratio |
|---|---|
| EPS-based Payout Ratio | 54.45 % |
| Free Cash Flow-based Payout Ratio | -96.24 % |
The EPS-based payout ratio of 54.45% indicates a balanced approach to dividend distribution. However, the negative FCF-based ratio suggests potential liquidity issues that warrant careful monitoring.
⚠️ Cashflow & Capital Efficiency
The cash flow and capital efficiency measures are key to assessing a company's capacity to sustain and grow its dividend payouts. The free cash flow yield and CAPEX to operating cash flow ratios are particularly telling of future dividend capacity.
| Metric | 2022 | 2023 | 2024 |
|---|---|---|---|
| Free Cash Flow Yield | -5.34 % | -7.57 % | -4.05 % |
| Earnings Yield | 5.09 % | 6.51 % | 6.52 % |
| CAPEX to Operating Cash Flow | 147.76 % | 157.52 % | 127.44 % |
| Stock-based Compensation to Revenue | 0.22 % | 0.00 % | 0.00 % |
| Free Cash Flow / Operating Cash Flow Ratio | -46.76 % | -57.52 % | -27.44 % |
While the negative free cash flow yield implies cash constraints, the stability in earnings yield partially counterbalances potential concerns. Nonetheless, careful attention should be paid to ensure ongoing capital efficiency and dividend coverage.
📊 Balance Sheet & Leverage Analysis
Analyzing balance sheet metrics and leverage ratios helps to understand how financially stable a company is and its capacity to weather financial turbulence, making it pivotal for dividend investors.
| Metric | 2022 | 2023 | 2024 |
|---|---|---|---|
| Debt-to-Equity | 1.62 | 1.71 | 1.73 |
| Debt-to-Assets | 0.42 | 0.43 | 0.43 |
| Debt-to-Capital | 0.62 | 0.63 | 0.63 |
| Net Debt to EBITDA | 5.53 | 5.49 | 5.66 |
| Current Ratio | 0.69 | 0.82 | 0.87 |
| Quick Ratio | 0.62 | 0.74 | 0.78 |
| Financial Leverage | 3.85 | 3.95 | 4.00 |
The increasing debt ratios may signal rising leverage, posing potential risks to financial stability. Investors should watch these metrics closely to ensure leverage remains sustainable.
📊 Fundamental Strength & Profitability
These metrics underscore Exelon's capacity to generate profits in relation to its equity and assets, crucial for maintaining dividend payouts and potential growth through reinvestment.
| Metric | 2022 | 2023 | 2024 |
|---|---|---|---|
| Return on Equity | 8.77 % | 9.04 % | 9.14 % |
| Return on Assets | 2.28 % | 2.29 % | 2.28 % |
| Net Profit Margin | 11.37 % | 10.71 % | 10.68 % |
| EBIT Margin | 20.18 % | 20.39 % | 19.89 % |
| EBITDA Margin | 37.61 % | 36.53 % | 35.50 % |
| Gross Profit Margin | 42.10 % | 41.09 % | 40.84 % |
Exelon's profitability metrics reflect good operational efficiency, supporting continued dividend health. Consistent returns on equity and assets assure investors of its ability to maintain payouts.
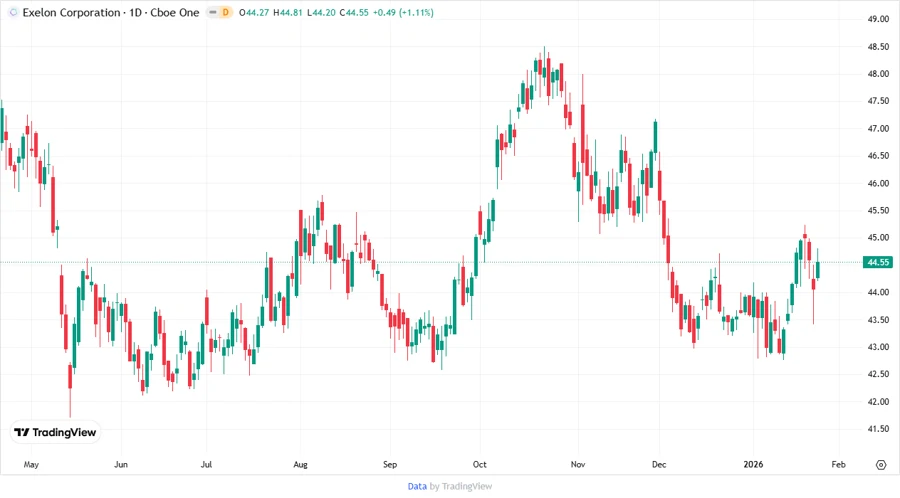
📉 Price Development
Dividend Scoring System
| Criteria | Score | Score Bar |
|---|---|---|
| Dividend Yield | 4 | |
| Dividend Stability | 5 | |
| Dividend Growth | 4 | |
| Payout Ratio | 3 | |
| Financial Stability | 3 | |
| Dividend Continuity | 5 | |
| Cashflow Coverage | 2 | |
| Balance Sheet Quality | 3 |
Total Score: 29 out of 40
🔍 Rating
Exelon Corporation presents a solid option for dividend investors with its impressive history and yield, moderate growth, and overall dividend security. While financial metrics show some pressure due to high leverage and negative free cash flow, the company's operational strength and commitment to dividends position it favorably in the income sector. Caution is advised, yet the overall outlook remains positive.