November 01, 2025 a 03:31 pm
EXC: Dividend Analysis - Exelon Corporation
Exelon Corporation demonstrates a robust dividend profile characterized by a solid history of distribution and consistent growth over five decades. With a moderate but stable dividend yield, the company positions itself as a reliable income generator for investors. Exelon's strategic approach in maintaining a reasonable payout ratio emphasizes its commitment to balancing dividend payouts with growth initiatives.
📊 Overview
Exelon Corporation operates within the Utilities sector, where it has maintained a favorable dividend yield of 3.47%. With an enduring history spanning 53 years without major interruptions since 2014, Exelon has demonstrated substantial resilience, offering a current dividend per share of 1.52 USD.
| Sector | Dividend Yield | Current Dividend per Share | Dividend History | Last Cut or Suspension |
|---|---|---|---|---|
| Utilities | 3.47% | 1.52 USD | 53 years | 2014 |
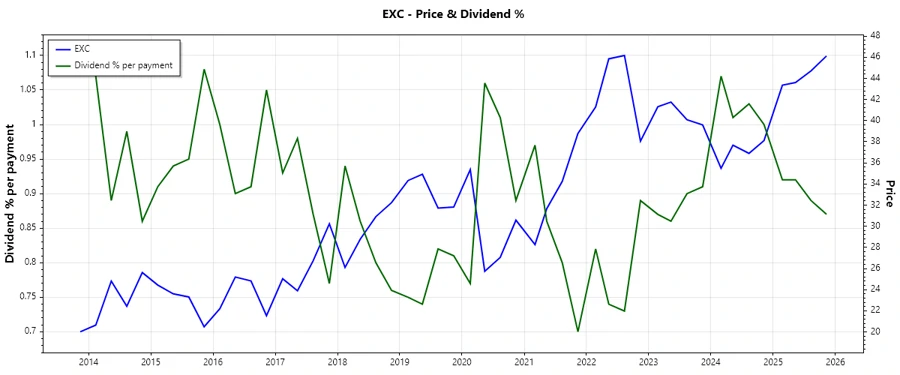
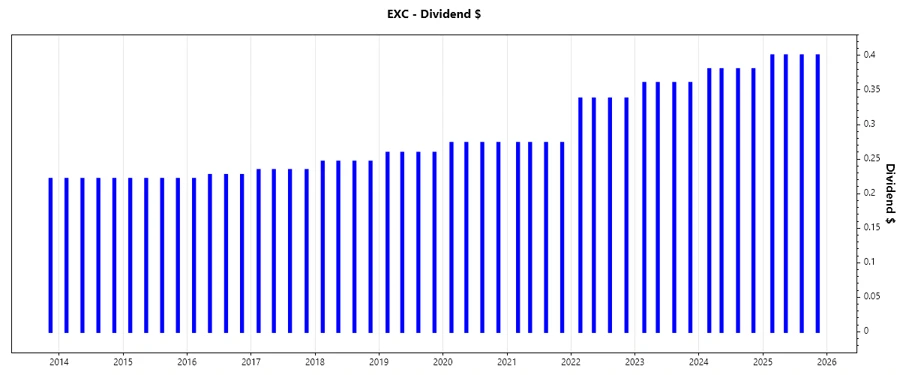
📈 Dividend History
Understanding Exelon's dividend history provides insights into its dividend policy's reliability and consistency. A company with stable or growing dividends often indicates financial health. The sustained dividend increases over recent years reinforce investor confidence.
| Year | Dividend per Share (USD) |
|---|---|
| 2025 | 1.60 |
| 2024 | 1.52 |
| 2023 | 1.44 |
| 2022 | 1.35 |
| 2021 | 1.09 |
📉 Dividend Growth
Dividend growth rates are pivotal for assessing a company's commitment to enhancing shareholder value. Exelon's dividend has shown positive growth figures over multiple timeframes.
| Time | Growth |
|---|---|
| 3 years | 11.63% |
| 5 years | 7.98% |
The average dividend growth is 7.98% over 5 years. This shows moderate but steady dividend growth.
✅ Payout Ratio
A company's payout ratios are critical metrics for dividend sustainability. Exelon's EPS-based payout ratio of 57.42% indicates a reasonable margin to sustain its current dividend outlay, while the negative FCF-based payout ratio suggests potential cash flow constraints that need attention.
| Key figure | Ratio |
|---|---|
| EPS-based | 57.42% |
| Free cash flow-based | -86.99% |
The EPS-based payout ratio is within typical utility sector norms, suggestive of sustainability, whereas the FCF ratio points to potential liquidity issues over certain periods.
👉 Cashflow & Capital Efficiency
An analysis of cash flow metrics and capital efficiency assists in understanding Exelon's financial stability and operational health.
| Metric | 2022 | 2023 | 2024 |
|---|---|---|---|
| Free Cash Flow Yield | -5.34% | -7.57% | -4.05% |
| Earnings Yield | 5.09% | 6.51% | 6.52% |
| CAPEX to Operating Cash Flow | 146.76% | 157.52% | 127.44% |
| Stock-based Compensation to Revenue | 0.21% | 0% | 0% |
| Free Cash Flow / Operating Cash Flow Ratio | -46.76% | -57.52% | -27.44% |
The data reveal challenges in maintaining positive cash flow, vital for ongoing capital projects and debt servicing, but improvements are seen in the recent year.
🏦 Balance Sheet & Leverage Analysis
Balance sheet metrics provide a window into Exelon's financial leverage, liquidity, and overall stability.
| Metric | 2022 | 2023 | 2024 |
|---|---|---|---|
| Debt-to-Equity | 1.62 | 1.71 | 1.73 |
| Debt-to-Assets | 0.42 | 0.43 | 0.43 |
| Debt-to-Capital | 0.62 | 0.63 | 0.63 |
| Net Debt to EBITDA | 5.53 | 5.49 | 5.66 |
| Current Ratio | 0.69 | 0.82 | 0.87 |
| Quick Ratio | 0.62 | 0.74 | 0.78 |
| Financial Leverage | 3.85 | 3.95 | 4.00 |
Exelon exhibits moderate financial leverage, with stable debt levels and a slight improvement in liquidity measures over time, indicative of prudent balance sheet management.
💼 Fundamental Strength & Profitability
Evaluating Exelon's profitability metrics sheds light on its operational efficiency and potential for sustained growth.
| Metric | 2022 | 2023 | 2024 |
|---|---|---|---|
| Return on Equity | 8.77% | 9.04% | 9.14% |
| Return on Assets | 2.28% | 2.29% | 2.28% |
| Margins: Net | 11.37% | 10.71% | 10.68% |
| EBIT | 20.18% | 20.39% | 19.89% |
| EBITDA | 37.61% | 36.53% | 35.50% |
| Gross | 42.10% | 41.09% | 40.84% |
| Research & Development to Revenue | 0% | 0% | 0% |
Exelon shows consistent profitability metrics, with strong margins contributing to solid returns on both equity and assets, underscoring efficient capital usage.
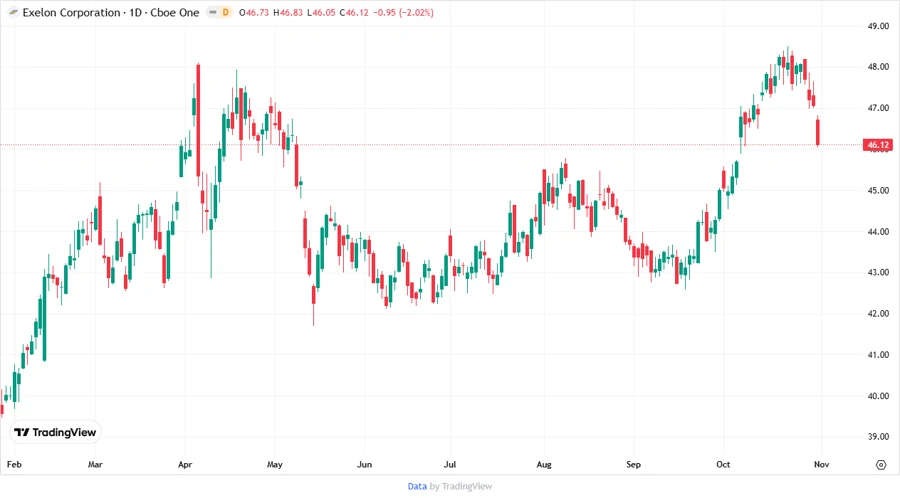
📈 Price Development
🎯 Dividend Scoring System
| Criteria | Score (out of 5) | Score Bar |
|---|---|---|
| Dividend yield | 4 | |
| Dividend Stability | 5 | |
| Dividend growth | 4 | |
| Payout ratio | 3 | |
| Financial stability | 3 | |
| Dividend continuity | 5 | |
| Cashflow Coverage | 2 | |
| Balance Sheet Quality | 4 |
Total Score: 30/40
💡 Rating
Exelon Corporation is positioned as a solid dividend paying stock within the Utilities sector, offering reliable yield with a history of consistency. The company should be viewed favorably by income-focused investors seeking to balance yield with moderate growth prospects. Additionally, caution may be advised regarding its cash flow coverage due to observed volatility in free cash flow metrics.
Smart Data Insight
Master the Perfect Entry & Exit for this Stock
Don't leave your profits to chance. Historically, this stock follows specific seasonal patterns that institutional traders use to maximize returns.
- ✅ Identify the "Golden Buying Window"
- ✅ Avoid high-risk correction cycles
- ✅ Backtested data from the last 20+ years