July 25, 2025 a 11:31 am


EXC: Dividend Analysis - Exelon Corporation
Exelon Corporation presents itself as a noteworthy candidate for investors seeking dividend income with a robust history of consistent payments over the past 53 years. While the dividend yield currently stands at a respectable 3.58%, notable market attention may be drawn to its moderate dividend growth rate and competitive payout ratio. Analysts are encouraged by Exelon’s ability to balance reinvestment needs with shareholder returns, underscoring the importance of understanding the associated risks and opportunities within its financial health.
📊 Overview
The Exelon Corporation operates within the utilities sector, providing essential infrastructure to support power needs. This has enabled the company to sustain a stable dividend yield at 3.58% and deliver a current dividend per share of $1.52. Its remarkable 53-year track record in dividend history underscores stability, with no recent cuts or suspensions reported.
| Aspect | Details |
|---|---|
| Sector | Utilities |
| Dividend yield | 3.58% |
| Current dividend per share | 1.52 USD |
| Dividend history | 53 years |
| Last cut or suspension | None |
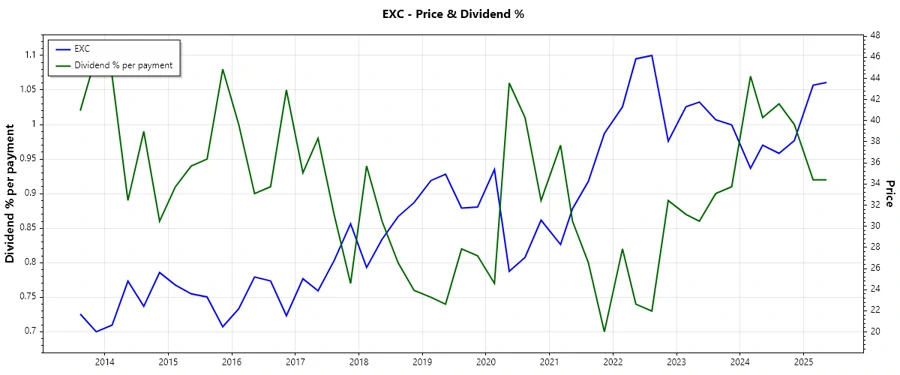
🗣️ Dividend History
Exelon Corporation exhibits a well-established history of stable dividend distributions, crucial for reinforcing investor confidence and predicting future performance.
| Year | Dividend per Share (USD) |
|---|---|
| 2025 | 0.80 |
| 2024 | 1.52 |
| 2023 | 1.44 |
| 2022 | 1.35 |
| 2021 | 1.09 |
📈 Dividend Growth
The dividend growth over the last 3 and 5 years demonstrates Exelon's cautious yet consistent approach to increasing shareholder rewards, a critical component for long-term valuation enhancement.
| Time | Growth |
|---|---|
| 3 years | 11.63% |
| 5 years | 7.98% |
The average dividend growth is 7.98% over 5 years. This shows moderate but steady dividend growth.
📉 Payout Ratio
The payout ratios reflect the company's financial prudence, critical for assessing dividend sustainability under varying economic conditions. Evaluating the EPS-based payout ratio reveals a moderately healthy level, ensuring reasonable coverage of its dividend commitments.
| Key figure | Ratio |
|---|---|
| EPS-based | 56.52% |
| Free cash flow-based | -102.33% |
The EPS-based payout ratio of 56.52% is within a sustainable range, although the negative FCF-based payout ratio of -102.33% indicates potential challenges in liquidity management.
✅ Cashflow & Capital Efficiency
Analyzing cash flows and capital efficiency is essential for understanding Exelon's operational strength and reinvestment capacity. The metrics reveal insights into how effectively Exelon is utilizing its capital and generating returns.
| Metric | 2024 | 2023 | 2022 |
|---|---|---|---|
| Free Cash Flow Yield | -4.05% | -7.57% | -5.34% |
| Earnings Yield | 6.52% | 6.51% | 5.09% |
| CAPEX to Operating Cash Flow | 127.44% | 157.52% | 146.76% |
| Stock-based Compensation to Revenue | 0.00% | 0.00% | 0.21% |
| Free Cash Flow / Operating Cash Flow Ratio | -27.44% | -57.52% | -46.76% |
| Return on Invested Capital | 3.93% | 3.61% | 3.18% |
The negative free cash flow yield might indicate limited cash resources, but a closer look at the capital efficiency suggests long-term reinvestment activities that could improve future cash flow positions.
⚠️ Balance Sheet & Leverage Analysis
Assessing the balance sheet provides clarity on Exelon's financial stability and capacity to meet its debt obligations while maintaining sufficient liquidity for operations.
| Metric | 2024 | 2023 | 2022 |
|---|---|---|---|
| Debt-to-Equity | 1.73 | 1.71 | 1.62 |
| Debt-to-Assets | 43.28% | 43.34% | 42.00% |
| Debt-to-Capital | 63.41% | 63.08% | 61.81% |
| Net Debt to EBITDA | 5.70 | 5.49 | 5.37 |
| Current Ratio | 0.87 | 0.81 | 0.69 |
| Quick Ratio | 0.78 | 0.73 | 0.62 |
| Financial Leverage | 4.00 | 3.94 | 3.85 |
The analysis indicates Exelon's leverage ratios are relatively high, suggesting a substantial proportion of the company’s capital structure is leveraged. However, the current and quick ratios suggest a decline in liquidity coverage, warranting cautious interpretation.
📊 Fundamental Strength & Profitability
The fundamental strengths in terms of profitability ensure that Exelon can maintain sustainable operations and reinvest appropriately while rewarding shareholders.
| Metric | 2024 | 2023 | 2022 |
|---|---|---|---|
| Return on Equity | 9.14% | 9.04% | 8.77% |
| Return on Assets | 2.28% | 2.29% | 2.28% |
| Net Margin | 10.68% | 10.71% | 11.37% |
| EBIT Margin | 19.89% | 20.39% | 20.18% |
| EBITDA Margin | 35.51% | 36.53% | 38.70% |
| Gross Margin | 42.88% | 41.09% | 42.10% |
| R&D to Revenue | 0.00% | 0.00% | 0.00% |
Exelon showcases solid profitability with consistent margins, albeit R&D spending is absent, potentially impacting future innovation and cost-effectiveness.
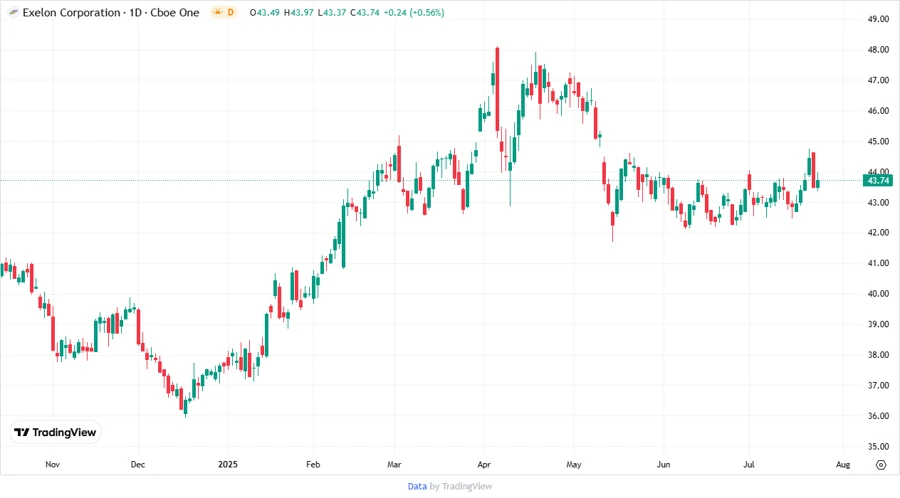
Price Development
📊 Dividend Scoring System
| Criterion | Score | Score-bar |
|---|---|---|
| Dividend yield | 3 | |
| Dividend Stability | 5 | |
| Dividend growth | 3 | |
| Payout ratio | 3 | |
| Financial stability | 4 | |
| Dividend continuity | 5 | |
| Cashflow Coverage | 2 | |
| Balance Sheet Quality | 3 |
Overall Score: 28/40
Rating
In conclusion, Exelon Corporation stands out as a solid dividend contender, offering a compelling blend of yield, stability, and continuity despite headwinds in cash flow management. Its commendable dividend history and financial stability suggest a cautious yet resilient investment case, deserving a moderate "Hold" recommendation for dividend-focused portfolios.
Smart Data Insight
Master the Perfect Entry & Exit for this Stock
Don't leave your profits to chance. Historically, this stock follows specific seasonal patterns that institutional traders use to maximize returns.
- ✅ Identify the "Golden Buying Window"
- ✅ Avoid high-risk correction cycles
- ✅ Backtested data from the last 20+ years