October 30, 2025 a 10:15 am

EW: Fibonacci Analysis - Edwards Lifesciences Corporation
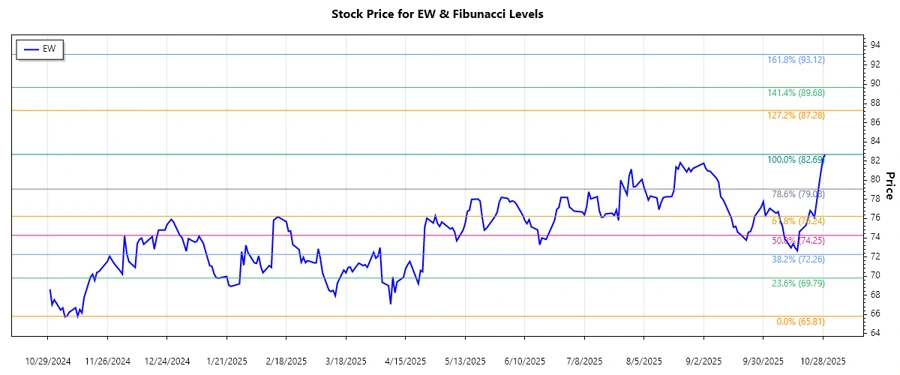
The Edwards Lifesciences Corporation stock has recently experienced a dominant uptrend, showcasing strong recovery over the past months. After reaching a low point earlier in the year, the stock has steadily increased, reflecting positive market response to its innovative structural heart disease solutions. As it closes on its recent high, the technical indicators suggest key levels to watch for potential support and resistance.
Fibonacci Analysis
| Attribute | Value |
|---|---|
| Trend Start Date | 2024-11-12 |
| Trend End Date | 2025-10-29 |
| High Price | $82.69 on 2025-10-29 |
| Low Price | $65.81 on 2024-11-12 |
| Fibonacci Levels |
|
| Current Price Retracement Zone | 0.236 |
| Technical Interpretation | The current price hovering around the 0.236 Fibonacci level suggests potential support, where investors may find entry points. A sustained move above this level could indicate further bullish momentum. |
Conclusion
In conclusion, Edwards Lifesciences Corporation's stock has shown remarkable upward momentum over the past year, primarily driven by advancements in its structural heart disease products. As the stock approaches significant Fibonacci retracement levels, it offers potential trading opportunities for investors. While the stock demonstrates bullish characteristics, market participants should consider the inherent risks of sudden corrections. Technical indicators point to key levels that may serve as support or resistance, thus guiding trading decisions effectively.
Smart Data Insight
Master the Perfect Entry & Exit for this Stock
Don't leave your profits to chance. Historically, this stock follows specific seasonal patterns that institutional traders use to maximize returns.
- ✅ Identify the "Golden Buying Window"
- ✅ Avoid high-risk correction cycles
- ✅ Backtested data from the last 20+ years