September 26, 2025 a 10:15 am
EW: Fibonacci Analysis - Edwards Lifesciences Corporation
The stock of Edwards Lifesciences Corporation has been showing a fluctuating trend in recent months. As a major player in the healthcare sector, known for its innovative heart valve technologies, the company's stock performance remains a focal point for investors. Despite some volatility, which is common in the medical technology industry, the overall trajectory presents both opportunities and risks for long-term investors.
Fibonacci Analysis
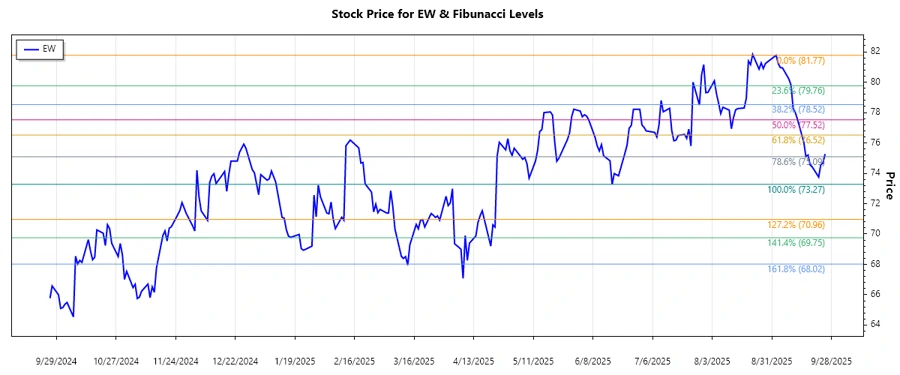
The recent price trend for Edwards Lifesciences Corporation shows a dominant downward movement, starting from a high in early September 2025 to a low by September 2025. A Fibonacci retracement analysis identifies key levels that could indicate potential areas of support and resistance.
| Trend Data | Value |
|---|---|
| Start Date | 2025-09-02 |
| End Date | 2025-09-25 |
| High Price (Date) | $81.77 (2025-09-02) |
| Low Price (Date) | $73.27 (2025-06-17) |
| Fibonacci Level | Price Level |
|---|---|
| 0.236 | $79.04 |
| 0.382 | $77.57 |
| 0.5 | $76.4 |
| 0.618 | $75.23 |
| 0.786 | $73.84 |
As of now, the current price of $75.27 situates it near the 0.618 Fibonacci retracement level. This indicates a potential support area, suggesting that the price may stabilize or rebound from this level.
The technical analysis suggests that if the stock remains above the 0.618 level, it could be a bullish sign, while a move below might indicate further downside risks.
Conclusion
Edwards Lifesciences Corporation faces both challenges and potential growth opportunities. The technical analysis indicates a possible stabilization at a critical Fibonacci level, offering a point of entry for vigilant investors. However, the stock’s trajectory may be influenced by factors such as market conditions, healthcare regulations, and advancements in medical technology. As always, investors should weigh the potential for innovation-led growth against inherent sector volatility.
Smart Data Insight
Master the Perfect Entry & Exit for this Stock
Don't leave your profits to chance. Historically, this stock follows specific seasonal patterns that institutional traders use to maximize returns.
- ✅ Identify the "Golden Buying Window"
- ✅ Avoid high-risk correction cycles
- ✅ Backtested data from the last 20+ years