July 02, 2026 a 01:15 pm

EVRG: Trend and Support & Resistance Analysis - Evergy, Inc.
Evergy, Inc. operates as an integrated electric utility serving Kansas and Missouri. The stock has recently shown a bullish trajectory, indicating investor confidence in its operational strategies and renewable energy initiatives. However, the current valuation may lead to profit booking, impacting the short-term trend. Monitoring the support and resistance zones will be crucial for future price movements.
Trend Analysis
The trend analysis reveals a notable bullish phase over the recent period, marked by an increase in stock prices. Analyzing the Exponential Moving Averages (EMAs):
| Date | Close Price | Trend |
|---|---|---|
| 2026-07-01 | $86.19 | ▲ Uptrend |
| 2026-06-30 | $86.43 | ▲ Uptrend |
| 2026-06-29 | $87.01 | ▲ Uptrend |
| 2026-06-26 | $87.21 | ▲ Uptrend |
| 2026-06-25 | $86.66 | ▲ Uptrend |
| 2026-06-24 | $85.82 | ▲ Uptrend |
| 2026-06-23 | $84.84 | ▲ Uptrend |
The EMA20 is consistently above the EMA50, suggesting a continuing uptrend. This indicates strong momentum in favor of Evergy, Inc.
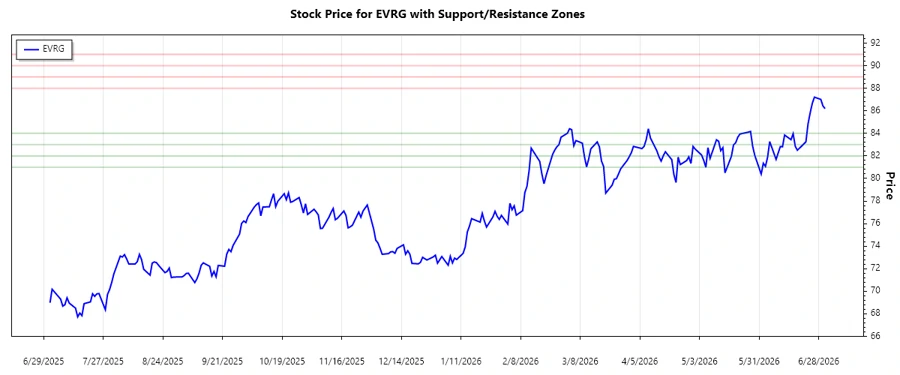
Support and Resistance
Analysis of support and resistance zones indicates significant levels where the stock may halt or reverse:
| Zone | From | To |
|---|---|---|
| Support Zone 1 | 83.00 | 84.00 |
| Support Zone 2 | 81.00 | 82.00 |
| Resistance Zone 1 | 88.00 | 89.00 |
| Resistance Zone 2 | 90.00 | 91.00 |
The current price is approaching the first resistance zone, suggesting a possible pause or reversal. It's critical for investors to watch the stock's movement closely as it nears this level.
Conclusion
Evergy, Inc. has shown a positive trend, primarily driven by its strategic initiatives and diversified energy mix. The bullish momentum suggests ongoing investor interest, but caution is advised as it approaches resistance levels. Key zones should be closely monitored to assess potential for continuation or reversal of current price dynamics. While opportunities for growth exist, the stock's proximity to resistance zones highlights the potential for short-term volatility.
Smart Data Insight
Master the Perfect Entry & Exit for this Stock
Don't leave your profits to chance. Historically, this stock follows specific seasonal patterns that institutional traders use to maximize returns.
- ✅ Identify the "Golden Buying Window"
- ✅ Avoid high-risk correction cycles
- ✅ Backtested data from the last 20+ years