September 01, 2025 a 09:03 am


EVRG: Trend and Support & Resistance Analysis - Evergy, Inc.
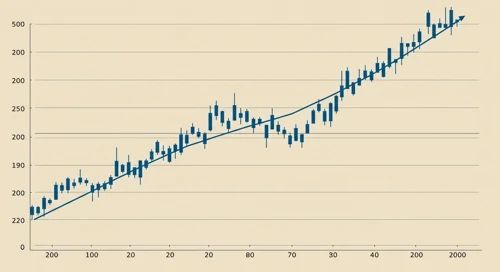
Evergy, Inc. has shown a resilience in its market performance amidst fluctuating energy sector trends. As a provider of diverse energy sources, Evergy's ability to integrate renewable generation alongside traditional methods positions it strategically for future growth. Recent price movements suggest consolidation, setting the stage for potential breakout opportunities.
Trend Analysis
| Date | Close Price ($) | Trend |
|---|---|---|
| 2025-08-29 | 71.26 | 🔻 |
| 2025-08-28 | 71.21 | 🔻 |
| 2025-08-27 | 72.06 | 🔺 |
| 2025-08-26 | 71.76 | 🔻 |
| 2025-08-25 | 71.65 | 🔻 |
| 2025-08-22 | 72.30 | 🔺 |
| 2025-08-21 | 72.54 | 🔺 |
The observed EMA20 is slightly above the EMA50, indicating an overall ▲ upward trend. However, fluctuations are evident, suggesting volatility and potential range-bound trading in the short term.
Support- and Resistance
| Type | Range ($) | |
|---|---|---|
| Support | 67.50 - 68.00 | 🟢 |
| Support | 70.00 - 70.50 | 🟢 |
| Resistance | 72.50 - 73.00 | 🔴 |
| Resistance | 74.00 - 74.50 | 🔴 |
The current price is close to the lower resistance range, suggesting that a breakout could challenge these levels. Investors should watch for price action near resistance for signs of retracement or continuation.
Conclusion
Evergy, Inc. presents a cautiously optimistic outlook with robust support and potential upside if resistance levels are breached. While the ▲ trend is hinted by moving averages, the close price proximity to resistance suggests vigilance. Risks include potential downturns if support fails, while opportunities lie in harnessing momentum above resistance thresholds. Long-term prospects are buoyed by Evergy's diverse energy mix, aligning with global shifts towards renewables.
Smart Data Insight
Master the Perfect Entry & Exit for this Stock
Don't leave your profits to chance. Historically, this stock follows specific seasonal patterns that institutional traders use to maximize returns.
- ✅ Identify the "Golden Buying Window"
- ✅ Avoid high-risk correction cycles
- ✅ Backtested data from the last 20+ years