September 16, 2025 a 03:15 pm

EVRG: Fibonacci Analysis - Evergy, Inc.
Evergy, Inc. is a key player in the utility sector, providing electricity across Kansas and Missouri with a mixed energy source base. Recently, the company's stock has shown notable fluctuations, reflecting both the economic conditions and changing energy demands. Understanding the technical trends in Evergy's stock can provide insightful forecasts for investors. Let's examine the trends and address the potential strategies for capitalizing on Evergy's market position.
Fibonacci Analysis
| Detail | Information |
|---|---|
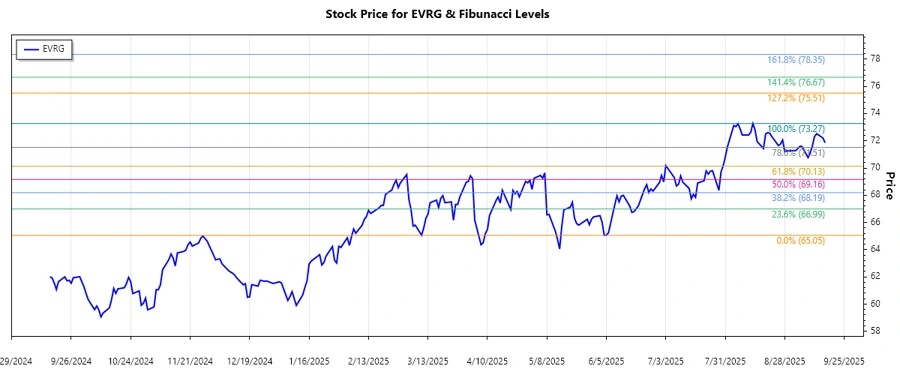
| Trend Start Date | 2025-06-06 |
| Trend End Date | 2025-09-16 |
| High Price (Date) | $73.27 on 2025-08-13 |
| Low Price (Date) | $65.05 on 2025-06-04 |
| Current Price | $71.855 on 2025-09-16 |
| Fibonacci Levels |
|
| Retracement Zone | Above 0.786 Retracement Level |
| Technical Interpretation | Current price indicates a significant bullish trend resumption, with the price above the potential support of the 0.786 level. |
Conclusion
Evergy, Inc. exhibits a strong upward trend which could attract bullish investors, aiming for higher returns. The current positioning above the key 0.786 Fibonacci level suggests bull market continuation, though caution is advised as market conditions can change abruptly. Possible risks include operational disruptions or regulatory changes. Investors should consider these factors and market sentiment to devise strategies. For analysts, vigilance in monitoring these Fibonacci levels is crucial for improving predictive accuracy and ensuring informed decision-making.
Smart Data Insight
Master the Perfect Entry & Exit for this Stock
Don't leave your profits to chance. Historically, this stock follows specific seasonal patterns that institutional traders use to maximize returns.
- ✅ Identify the "Golden Buying Window"
- ✅ Avoid high-risk correction cycles
- ✅ Backtested data from the last 20+ years