July 11, 2025 a 10:15 am

EVRG: Fibonacci Analysis - Evergy, Inc.
The share price of Evergy, Inc. (Ticker: EVRG) exhibits resilience amid volatile market conditions. The presence of renewable energy sources in its operational framework suggests potential for growth, given the global shift towards sustainability. However, the stock's performance is highly dependent on regulatory changes in the energy sector and fluctuations in raw material costs. Investors should remain cautious and monitor market trends closely.
Fibonacci Analysis
| Detail | Value |
|---|---|
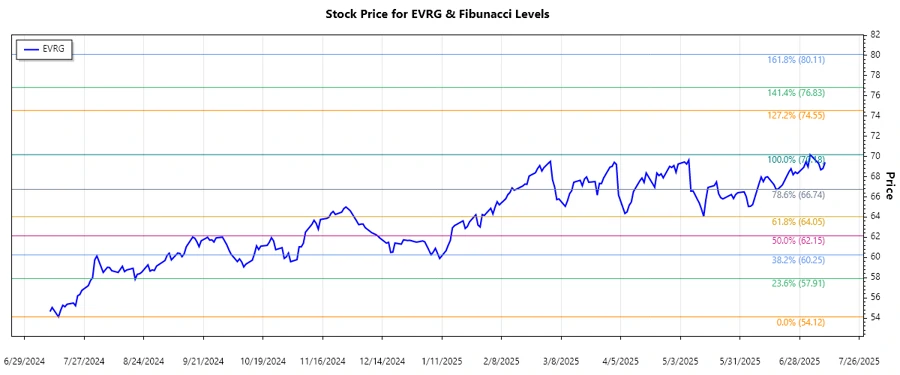
| Trend Start Date | 2024-07-11 |
| Trend End Date | 2025-07-10 |
| High Price (Date) | $70.18 (2025-07-03) |
| Low Price (Date) | $54.12 (2024-07-15) |
The calculated Fibonacci retracement levels are as follows:
| Fibonacci Level | Price Level |
|---|---|
| 0.236 | $58.97 |
| 0.382 | $61.28 |
| 0.5 | $62.15 |
| 0.618 | $64.01 |
| 0.786 | $66.34 |
Currently, the share is approximately trading at $69.42, positioned above all key Fibonacci retracement levels. It has moved beyond the retracement zones, indicating a potential continuing uptrend. This could signify strong technical support for the stock if it remains above these levels.
Conclusion
Evergy, Inc.'s (EVRG) stock continues to demonstrate a robust uptrend, having surpassed key Fibonacci retracement levels, which might imply sustained investor confidence. The emphasis on sustainable and renewable energy positions Evergy well for future growth. Nonetheless, challenges persist, such as regulatory changes and input costs that could impact profitability. Investors should weigh these factors while considering Evergy within their portfolios.
Smart Data Insight
Master the Perfect Entry & Exit for this Stock
Don't leave your profits to chance. Historically, this stock follows specific seasonal patterns that institutional traders use to maximize returns.
- ✅ Identify the "Golden Buying Window"
- ✅ Avoid high-risk correction cycles
- ✅ Backtested data from the last 20+ years