February 19, 2026 a 03:31 pm
EVRG: Dividend Analysis - Evergy, Inc.
Evergy, Inc. presents a solid dividend profile with a robust history of payments, a modest dividend yield and consistent growth over the years. Given the substantial market capitalization of EVRG and its long-standing dividend history of 41 years, it continues to be a reliable choice for income-focused investors. The company's commitment to maintaining stable dividend payments is further underscored by its strategic financial metrics.
📊 Overview
Evergy operates within a stable sector, characterized by its focus on providing a consistent dividend yield and maintaining a robust dividend history.
| Key Metrics | Value |
|---|---|
| Sector | Utilities |
| Dividend yield | 3.556% |
| Current dividend per share | 2.66 USD |
| Dividend history | 41 years |
| Last cut or suspension | 2003 |
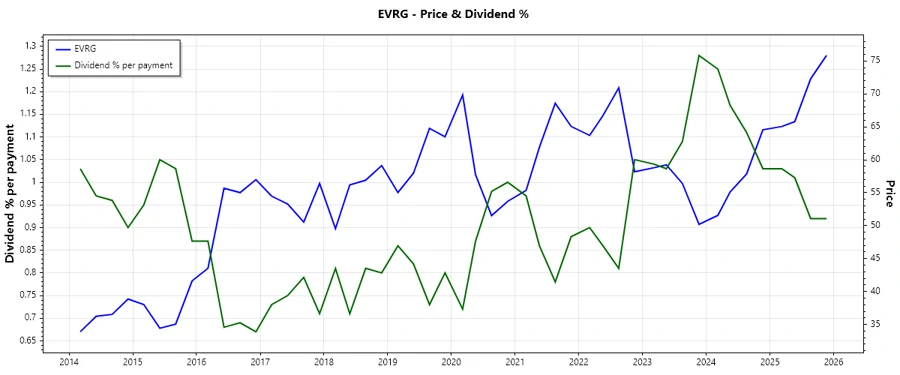
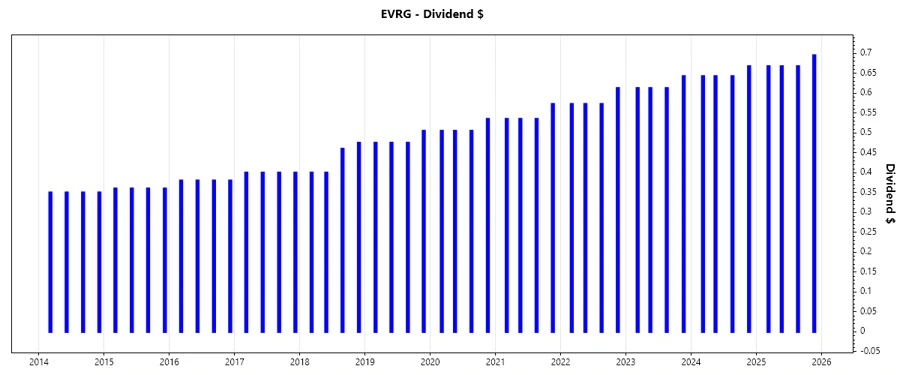
🗣️ Dividend History
Evergy's long-standing dividend payment history is a testament to its financial durability and commitment to shareholder returns, making it an attractive choice for long-term income.
| Year | Dividend per Share (USD) |
|---|---|
| 2025 | 2.6975 |
| 2024 | 2.5950 |
| 2023 | 2.4800 |
| 2022 | 2.3300 |
| 2021 | 2.1775 |
📈 Dividend Growth
Understanding dividend growth is crucial as it reflects a company's earnings expansion capacity and its commitment to returning value to shareholders.
| Time | Growth |
|---|---|
| 3 years | 5.00% |
| 5 years | 5.64% |
The average dividend growth is 5.64% over 5 years. This shows moderate but steady dividend growth.
💡 Payout Ratio
A high payout ratio can suggest a potential risk of unsustainable dividends, while a low ratio may indicate room for dividend growth.
| Key figure | Ratio |
|---|---|
| EPS-based | 72.17% |
| Free cash flow-based | -180.21% |
With an EPS payout ratio of 72.17%, Evergy distributes a significant portion of its profits, balanced by operational cash flow constraints expressed in the negative FCF-based payout ratio.
💰 Cashflow & Capital Efficiency
Examining cash flow metrics gives insight into its financial stability and ability to finance growth through retained earnings.
| Metric | 2025 | 2024 | 2023 |
|---|---|---|---|
| Free Cash Flow Yield | -4.50% | -2.49% | -2.88% |
| Earnings Yield | 5.12% | 6.16% | 5.95% |
| CAPEX to Operating Cash Flow | 1.3675 | 1.1779 | 1.1787 |
| Stock-based Compensation to Revenue | 0.35% | 0.26% | 0.32% |
| Free Cash Flow / Operating Cash Flow Ratio | -36.75% | -17.78% | -17.87% |
Evergy's cash flow analysis reveals necessary vigilance over negative free cash flow yields, indicating pressure in operational cash generation and capital allocation efficiency.
📉 Balance Sheet & Leverage Analysis
A company's leverage ratios provide insight into the use of debt financing versus equity, crucial for evaluating risk and operational flexibility.
| Metric | 2025 | 2024 | 2023 |
|---|---|---|---|
| Debt-to-Equity | 0.024 | 1.413 | 1.361 |
| Debt-to-Assets | 0.018 | 0.436 | 0.424 |
| Debt-to-Capital | 0.023 | 0.586 | 0.576 |
| Net Debt to EBITDA | 0.092 | 5.318 | 5.429 |
| Current Ratio | 0.078 | 0.502 | 0.509 |
| Quick Ratio | 0.078 | 0.265 | 0.288 |
| Financial Leverage | 1.316 | 3.243 | 3.206 |
Evergy's leverage ratios indicate a cautious approach to debt with lower short-term liquidity but stable long-term financial structures.
📊 Fundamental Strength & Profitability
Conclusion on fundamental analysis allows investors to assess historical returns against potential future performance.
| Metric | 2025 | 2024 | 2023 |
|---|---|---|---|
| Return on Equity | 8.37% | 8.77% | 7.57% |
| Return on Assets | 6.36% | 2.71% | 2.36% |
| Margins: Net | 14.35% | 14.99% | 13.33% |
| Margins: Gross | 83.30% | 32.57% | 30.37% |
| Research & Development to Revenue | 0% | 0% | 0% |
Evergy showcases decent profitability metrics, with consistent returns on equity and assets, reflecting a strong operational footing.
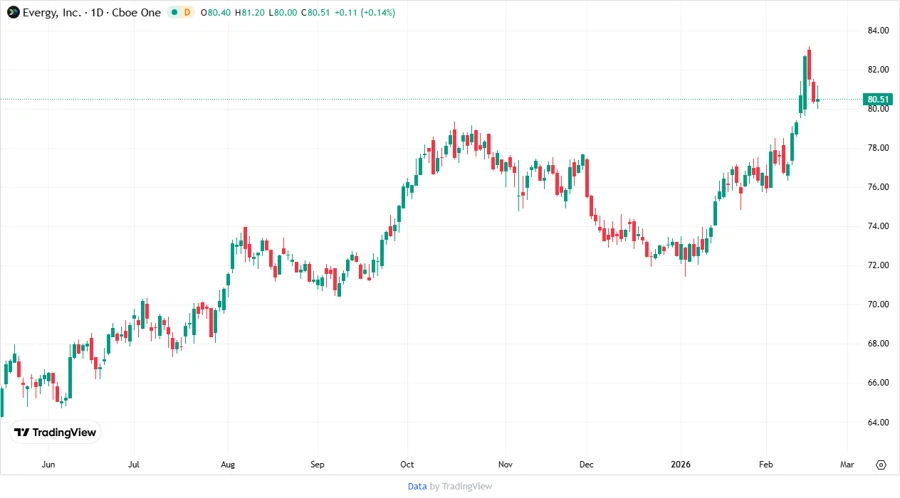
🔍 Price Development
📊 Dividend Scoring System
| Category | Score | Score Bar |
|---|---|---|
| Dividend yield | 4 | |
| Dividend Stability | 5 | |
| Dividend growth | 4 | |
| Payout ratio | 3 | |
| Financial stability | 3 | |
| Dividend continuity | 5 | |
| Cashflow Coverage | 2 | |
| Balance Sheet Quality | 3 |
Overall Score: 29/40
🗣️ Rating
Evergy, Inc. earns a solid rating in our analysis, reflecting its robust dividend history, steady growth, and financial mechanisms. While facing operational cash constraints, its long-standing commitment to shareholder returns signifies resilience and reliability in its sector. Investors may view Evergy as a stable long-term investment for dividend income.
Smart Data Insight
Master the Perfect Entry & Exit for this Stock
Don't leave your profits to chance. Historically, this stock follows specific seasonal patterns that institutional traders use to maximize returns.
- ✅ Identify the "Golden Buying Window"
- ✅ Avoid high-risk correction cycles
- ✅ Backtested data from the last 20+ years