November 17, 2025 a 07:47 am
EVRG: Dividend Analysis - Evergy, Inc.
Evergy, Inc. demonstrates a strong long-term commitment to dividends, backed by over four decades of uninterrupted payments. This analysis will provide a comprehensive overview of the company's dividend profile, including yield, growth, and payout ratios. Investors may find the company's steady dividend history and reliable growth appealing, despite potential concerns about free cash flow.
Overview 📊
As an electricity utility company, Evergy, Inc. operates in the Utilities sector, known for stable cash flows and reliable dividend payouts. The company's current dividend yield stands at 3.53% with a current dividend per share of $2.59, making it an attractive option for yield-focused investors. With a 41-year history of dividend payments and the last cut in 2003, Evergy maintains a reputation for stability.
| Metric | Value |
|---|---|
| Sector | Utilities |
| Dividend yield | 3.53% |
| Current dividend per share | $2.59 USD |
| Dividend history | 41 years |
| Last cut or suspension | 2003 |
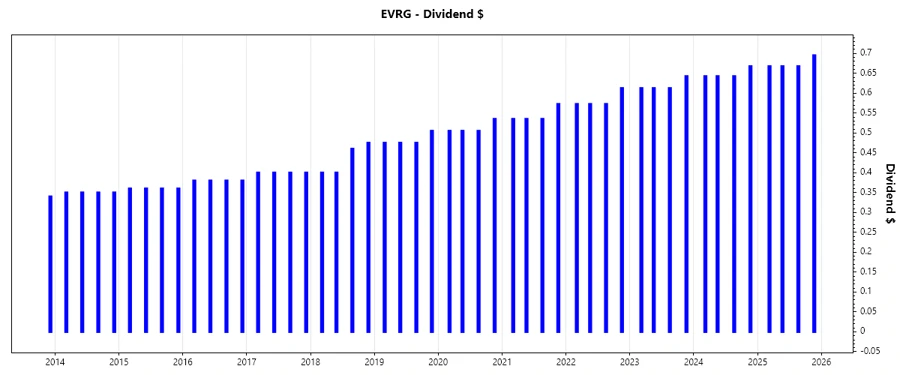
Dividend History 🏛️
Evergy's dividend history highlights its commitment to shareholders, with consistent annual increases fostering investor confidence. This track record is a testament to the company's prudent financial management and stable earnings.
| Year | Dividend per Share (USD) |
|---|---|
| 2025 | 2.6975 |
| 2024 | 2.5950 |
| 2023 | 2.4800 |
| 2022 | 2.3300 |
| 2021 | 2.1775 |
Dividend Growth 📈
Dividend growth is a crucial metric for assessing the potential for future income increases. Evergy's dividend growth over the last 3 years is 6.02%, slightly increasing to 6.10% over the past 5 years, reflecting moderate but consistent growth.
| Time | Growth |
|---|---|
| 3 years | 6.02% |
| 5 years | 6.10% |
The average dividend growth is 6.10% over 5 years. This shows moderate but steady dividend growth, appealing for investors seeking increasing income.
Payout Ratio ⚠️
The payout ratio is a key factor in determining the sustainability of dividends. Evergy's EPS-payout ratio is 70.30%, which is within a reasonable range for utility companies. However, the free cash flow payout ratio of -431.60% is concerning, indicating that dividends are not covered by cash flow.
| Key figure | Ratio |
|---|---|
| EPS-based | 70.30% |
| Free cash flow-based | -431.60% |
While the EPS payout is acceptable, the negative free cash flow payout suggests reliance on other funding sources for dividend distribution, posing a potential risk to dividend stability.
Cashflow & Capital Efficiency 🏛️
Cash flow and capital efficiency are fundamental in assessing a company's ability to maintain investments while rewarding shareholders. The metrics below highlight the challenges Evergy faces with cash flow and investment efficiency.
| Year | 2024 | 2023 | 2022 |
|---|---|---|---|
| Free Cash Flow Yield | -2.49% | -2.95% | -2.52% |
| Earnings Yield | 6.16% | 6.09% | 5.20% |
| CAPEX to Operating Cash Flow | 117.8% | 117.8% | 120.2% |
| Stock-based Compensation to Revenue | 0% | 0.32% | 0.32% |
| Free Cash Flow / Operating Cash Flow Ratio | -17.79% | -17.87% | -20.23% |
The negative free cash flow yield and high CAPEX to operating cash flow ratio highlight potential liquidity challenges; improvements in these areas could bolster dividend security.
Balance Sheet & Leverage Analysis 🏢
A healthy balance sheet is crucial for dividend safety. Evergy's leverage ratios indicate a standard level of debt utilization for utilities, though improvements in liquidity metrics would enhance financial flexibility.
| Year | 2024 | 2023 | 2022 |
|---|---|---|---|
| Debt-to-Equity | 1.41 | 1.36 | 1.27 |
| Debt-to-Assets | 43.58% | 42.44% | 40.81% |
| Debt-to-Capital | 58.56% | 57.64% | 55.93% |
| Net Debt to EBITDA | 5.32 | 5.43 | 5.47 |
| Current Ratio | 0.50 | 0.51 | 0.53 |
| Quick Ratio | 0.26 | 0.29 | 0.33 |
| Financial Leverage | 3.24 | 3.21 | 3.11 |
The ratios indicate standard financial utilization but suggest a need for continual monitoring of liquidity, ensuring that the company can meet its debt obligations without constraining capital for dividends.
Fundamental Strength & Profitability 🚀
Profitability measures signify Evergy's ability to generate earnings efficiently. They offer confidence in the company's operational prowess, ensuring long-term dividend payouts.
| Metric | 2024 | 2023 | 2022 |
|---|---|---|---|
| Return on Equity | 8.77% | 7.57% | 7.94% |
| Return on Assets | 2.71% | 2.36% | 2.55% |
| Net Profit Margin | 14.94% | 13.28% | 12.85% |
| EBIT Margin | 25.16% | 23.19% | 20.64% |
| EBITDA Margin | 45.18% | 43.87% | 37.45% |
| Gross Profit Margin | 51.90% | 50.21% | 44.88% |
| R&D to Revenue | 0% | 0% | 0% |
These profitability ratios underscore Evergy's capacity to sustain dividend payments by demonstrating operational efficiency and robust returns on equity.
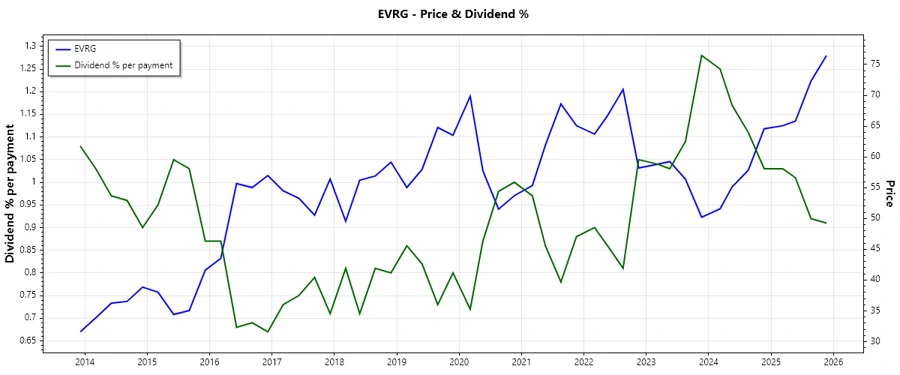
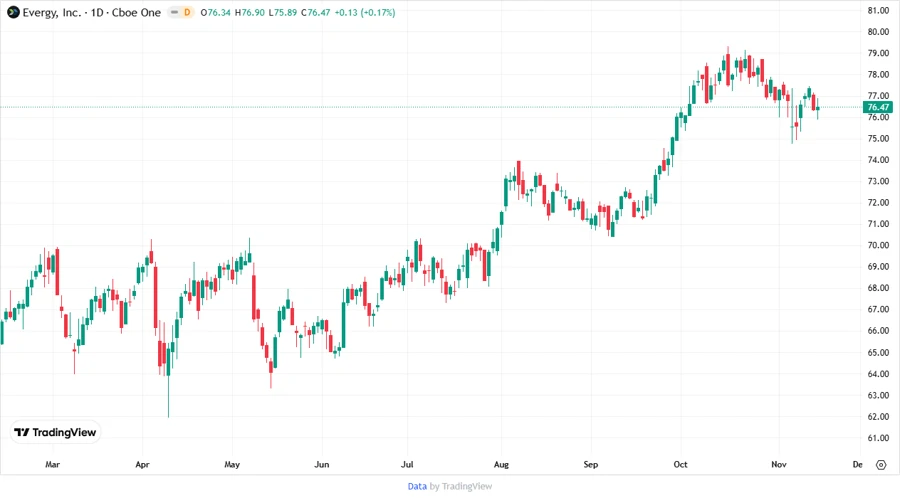
Price Development 📉
Dividend Scoring System 💹
| Category | Score | Score Bar |
|---|---|---|
| Dividend Yield | 4 | |
| Dividend Stability | 5 | |
| Dividend Growth | 4 | |
| Payout Ratio | 3 | |
| Financial Stability | 3 | |
| Dividend Continuity | 5 | |
| Cashflow Coverage | 2 | |
| Balance Sheet Quality | 3 |
Total Score: 29/40
Rating 🗣️
Evergy, Inc. offers a reliable and stable dividend with consistent growth, making it a robust choice for conservative, income-seeking investors. While free cash flow needs attention, the company's management team shows commitment to maintaining their dividend record intact.
Smart Data Insight
Master the Perfect Entry & Exit for this Stock
Don't leave your profits to chance. Historically, this stock follows specific seasonal patterns that institutional traders use to maximize returns.
- ✅ Identify the "Golden Buying Window"
- ✅ Avoid high-risk correction cycles
- ✅ Backtested data from the last 20+ years