
July 20, 2026 a 04:28 am

EURUSD: Trend and Support & Resistance Analysis
The EURUSD currency pair has exhibited a notable pattern over the last few months. With a series of fluctuations, the trend has primarily shown a weakening of the Euro against the Dollar. Understanding the key support and resistance levels, traders can make informed decisions. As the market navigates a volatile period, adopting a cautious trading approach is crucial. Fundamental macroeconomic factors also play a significant role in the ongoing trend dynamics.
Trend Analysis
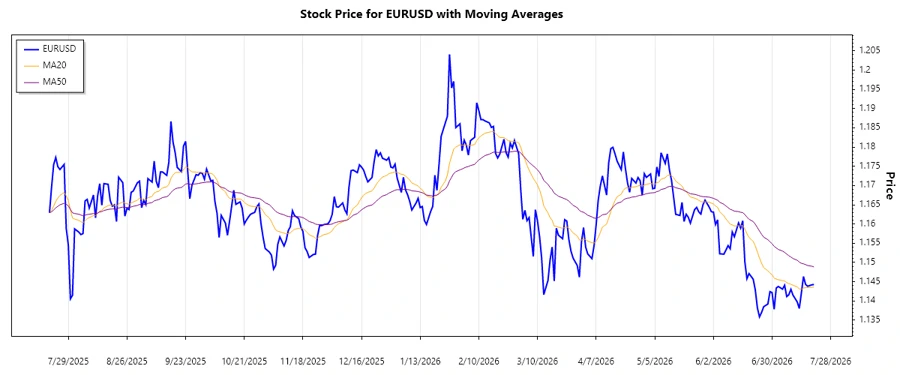
The EURUSD pair has seen an observable shift in trends over the recent months. By calculating the Exponential Moving Averages (EMAs), specifically the EMA20 and EMA50 using the closing prices, one can identify the prevailing trend. The recent data shows a mixing of trend signals indicating market uncertainty.
| Date | Closing Price | Trend |
|---|---|---|
| 2026-07-20 | 1.14428 | ▼ |
| 2026-07-19 | 1.1442 | ▼ |
| 2026-07-17 | 1.14382 | ▼ |
| 2026-07-16 | 1.14431 | ▲ |
| 2026-07-15 | 1.14636 | ▲ |
| 2026-07-14 | 1.14209 | ▼ |
| 2026-07-13 | 1.13804 | ▼ |
The recent data indicates a dominant downward trend in recent days. The EMA calculations suggest that EMA20 is slightly below EMA50, signaling a downtrend, albeit with fluctuations.
Support and Resistance
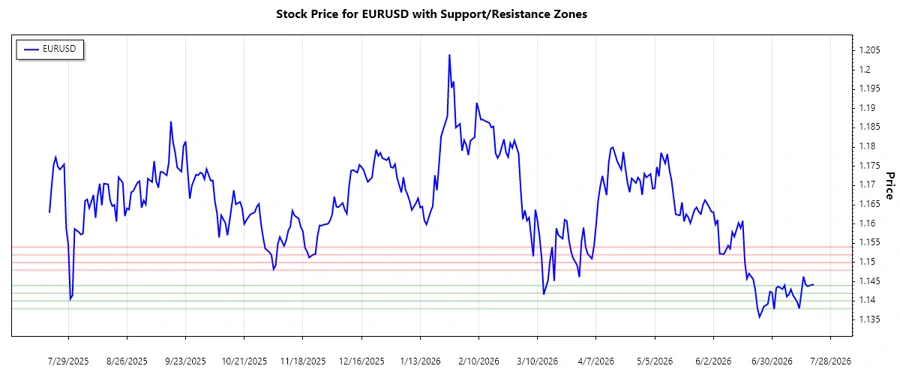
Evaluating past price data allows us to highlight key support and resistance zones for the EURUSD. The data reveals significant areas that have historically held or resisted price movements.
| Zone | Price Levels |
|---|---|
| Support Zone 1 | 1.1380 - 1.1400 ▼ |
| Support Zone 2 | 1.1420 - 1.1440 ▼ |
| Resistance Zone 1 | 1.1480 - 1.1500 ▲ |
| Resistance Zone 2 | 1.1520 - 1.1540 ▲ |
The current price is hovering around the lower support zone. This indicates a potential for a rebound unless bearish momentum continues.
Conclusion
The EURUSD demonstrates a complex trading environment with a leaning towards downward momentum. The key support levels suggest potential bounce points, yet caution is urged given the current market volatility. Resistance levels may pose challenges for a significant upward move, suggesting a period of consolidation or further declines. Traders should remain adaptable, closely monitoring economic indicators and geopolitical developments, which could further influence market direction.
Smart Data Insight
Master the Perfect Entry & Exit for this Stock
Don't leave your profits to chance. Historically, this stock follows specific seasonal patterns that institutional traders use to maximize returns.
- ✅ Identify the "Golden Buying Window"
- ✅ Avoid high-risk correction cycles
- ✅ Backtested data from the last 20+ years