June 25, 2026 a 04:28 am

EURUSD: Trend and Support & Resistance Analysis
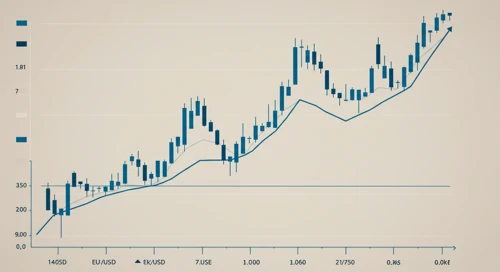
The EURUSD currency pair recently experienced a slight decline, with current pricing showing instability around support levels. Technical indicators suggest potential for recovery, but caution is advised as the short-term moving averages indicate a bearish trend. Traders should be vigilant about forthcoming economic events that may influence the currency's direction. Pay attention to the identified support and resistance zones for potential trading opportunities.
Trend Analysis
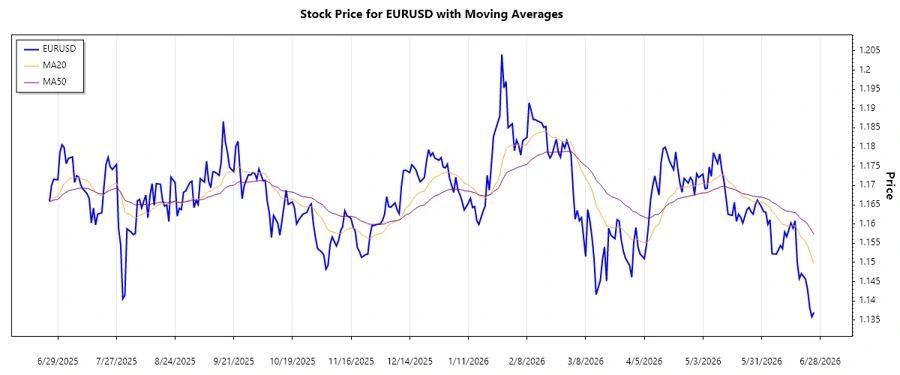
The recent pricing data for EURUSD demonstrates a fluctuating trend with the 20-day EMA (Exponential Moving Average) currently below the 50-day EMA, indicating a bearish trend (▼). Analysis of the last week shows a consistent downward movement in prices, with minor fluctuations offering brief recoveries. This trend highlights bearish market sentiment.
| Date | Close Price | Trend |
|---|---|---|
| 2026-06-25 | 1.13702 | ▼ |
| 2026-06-24 | 1.13586 | ▼ |
| 2026-06-23 | 1.13818 | ▲ |
| 2026-06-22 | 1.14284 | ▲ |
| 2026-06-21 | 1.14564 | ▲ |
| 2026-06-19 | 1.14712 | ▲ |
| 2026-06-18 | 1.14579 | ▼ |
The continuation of the bearish trend suggests a possible further decline. Traders should consider this in their strategies to mitigate risks.
Support- and Resistance
Reviewing the trading range, the critical support and resistance zones are identified as follows:
| Zone Type | From Price | To Price |
|---|---|---|
| Support | 1.13500 | 1.13700 |
| Support | 1.14500 | 1.14700 |
| Resistance | 1.15500 | 1.15700 |
| Resistance | 1.16500 | 1.16700 |
Currently, the close price is hovering within the lower support zone, indicating a potential rebound or break through, needing close monitoring.
Technically, if the support level holds, there may be an opportunity for a bullish correction. However, traders should watch for any breaches of this support that could signal continued bearish movements.
Conclusion
The EURUSD is exhibiting a bearish trend, with prices currently testing key support zones. The downward trend in the short-term moving averages confirms a sell bias. However, support zones present possible opportunities for a reversal if they hold against the selling pressure. Analysts should remain cautious and consider external economic factors as they affect forex volatility. With potential recoveries hinging on these support levels, monitoring the charts closely is essential for timely market decisions.
Smart Data Insight
Master the Perfect Entry & Exit for this Stock
Don't leave your profits to chance. Historically, this stock follows specific seasonal patterns that institutional traders use to maximize returns.
- ✅ Identify the "Golden Buying Window"
- ✅ Avoid high-risk correction cycles
- ✅ Backtested data from the last 20+ years