May 05, 2026 a 04:28 am

EURUSD: Trend and Support & Resistance Analysis
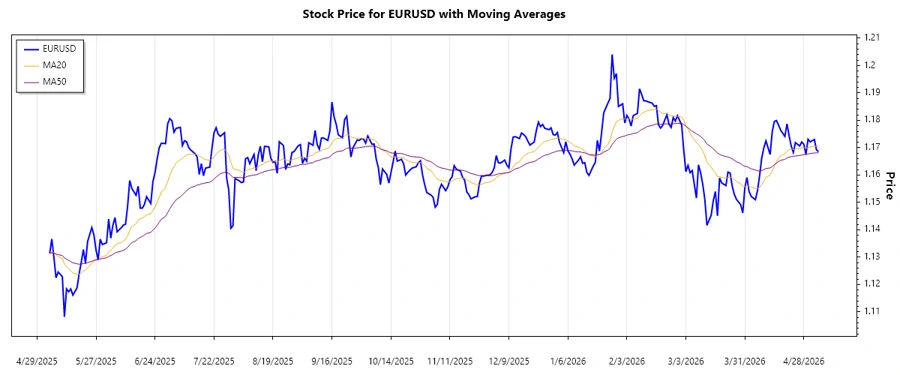
The analysis of the EURUSD currency pair indicates subtle variations over the recent weeks, showcasing both bullish and bearish tendencies. This intricate fluctuation signals a transitional phase possibly influenced by macroeconomic factors. Investors may find opportunities in these fluctuations by carefully observing the short and long-term moving averages.
Trend Analysis
The EURUSD has displayed variable trading patterns over the analyzed period. The short-term EMA20 slightly exceeds the longer-term EMA50, hinting at transient bullish momentum. Below is a summary of the last seven trading days:
| Date | Closing Price | Trend |
|---|---|---|
| 2026-05-05 | 1.1686 | ▲ Uptrend |
| 2026-05-04 | 1.16918 | ▲ Uptrend |
| 2026-05-03 | 1.173 | ▲ Uptrend |
| 2026-05-01 | 1.17212 | ▲ Uptrend |
| 2026-04-30 | 1.17308 | ▲ Uptrend |
| 2026-04-29 | 1.16757 | ▼ Downtrend |
| 2026-04-28 | 1.17127 | ▲ Uptrend |
Technical analysis suggests a cautiously optimistic outlook, with potential bullish implications if EMA20 holds steady above EMA50, presenting a solid buying opportunity.
Support- and Resistance
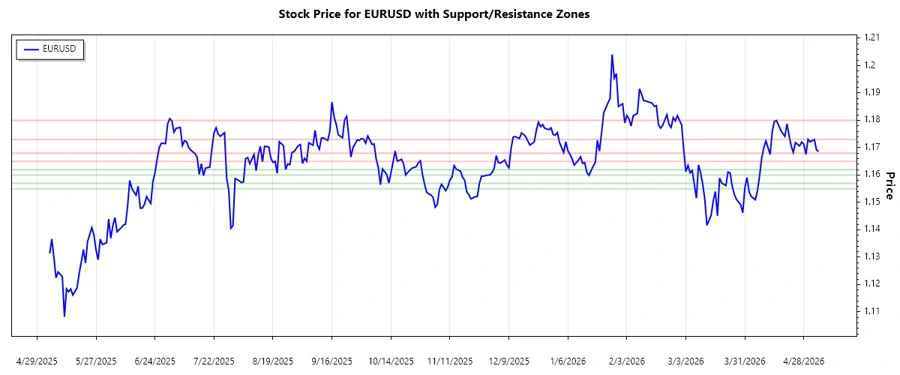
The recent price action highlights significant support and resistance zones. Recognizing these levels could enhance decision-making processes for market participants.
| Zone | From | To |
|---|---|---|
| Resistance 1 | 1.1730 | 1.1800 |
| Resistance 2 | 1.1650 | 1.1680 |
| Support 1 | 1.1600 | 1.1620 |
| Support 2 | 1.1550 | 1.1570 |
The current price finds itself enclosed between these pivotal levels, implying potential for consolidation or breakout scenarios.
Conclusion
The technical overview of the EURUSD suggests mild upward potential, but with caution as the currency pair remains within delicate support and resistance bounds. With EMA20 maintaining slightly above EMA50, bullish sentiments prevail unless macroeconomic narratives alter this alignment. At present, technical studies offer a balanced view, emphasizing breakout vigilance while navigating the complex forex landscape.
Smart Data Insight
Master the Perfect Entry & Exit for this Stock
Don't leave your profits to chance. Historically, this stock follows specific seasonal patterns that institutional traders use to maximize returns.
- ✅ Identify the "Golden Buying Window"
- ✅ Avoid high-risk correction cycles
- ✅ Backtested data from the last 20+ years