February 12, 2026 a 04:28 am
EURUSD: Trend and Support & Resistance Analysis
The EURUSD exchange rate has experienced notable fluctuations over recent months. Through technical analysis, it's clear that recent trends have been dynamic, influenced by several economic factors. By examining EMAs and price patterns, traders can gain insights into potential future movements. Identifying key support and resistance zones further enriches this analysis, allowing the formulation of strategic entry and exit points. Current analysis suggests strategic opportunities in the forex market, driven by both technical indicators and broader economic events.
Trend Analysis
| Date | Close Price | Trend |
|---|---|---|
| 2026-02-12 | 1.18637 | ▲ |
| 2026-02-11 | 1.18714 | ▲ |
| 2026-02-10 | 1.18948 | ▲ |
| 2026-02-09 | 1.19151 | ▲ |
| 2026-02-08 | 1.18254 | ▲ |
| 2026-02-06 | 1.18168 | ▲ |
| 2026-02-05 | 1.17792 | ▲ |
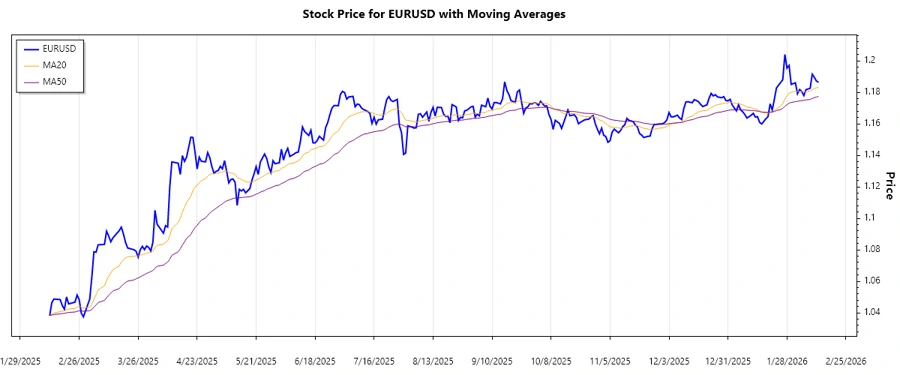
The calculated EMAs suggest an upward trend, as EMA20 is consistently above EMA50. This is indicative of a bullish outlook, which could potentially continue barring any major economic disruptions.
Support and Resistance
| Zone | Level |
|---|---|
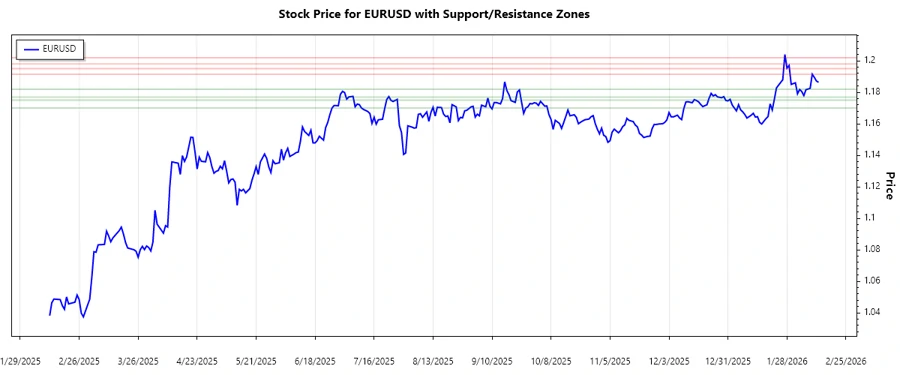
| Support 1 | 1.1820 ◄ |
| Support 2 | 1.1770 ◄ |
| Resistance 1 | 1.1915 ► |
| Resistance 2 | 1.1950 ► |
The EURUSD is currently trading near its first resistance level and may challenge these highs if upward momentum persists. It's essential to monitor how the price reacts around this zone, as a break could suggest further bullish strength.
Conclusion
The EURUSD has shown a bullish trend as indicated by the EMA analysis, and its position near resistance levels suggests a crucial point for traders. While the potential for upward movement exists, traders should be cautious of abrupt reversals. Identifying key support and resistance zones allows for strategic decision-making. As market dynamics continue to unfold, monitoring economic reports and global events will be key to anticipating future price action. The current outlook presents both opportunities and risks; traders are advised to stay vigilant and adaptable.
json Note: The analysis above assumes a simplified calculation of EMA values based on historical price data provided. In practice, a more rigorous calculation using a complete data set is recommended.