January 21, 2026 a 04:28 am

EURUSD: Trend and Support & Resistance Analysis
The EURUSD pair has shown interesting movements in the recent months, experiencing both upward and downward trends. As we break down the technical data, the prevailing trend appears to lean towards an upwards trajectory. Critical support and resistance zones are becoming apparent, important for traders to consider. Understanding these zones can provide crucial insights for making informed trading decisions.
Trend Analysis
The following table displays the closing prices, accompanied by an interpretation of trend direction based on EMA20 and EMA50.
| Date | Close Price | Trend |
|---|---|---|
| 2026-01-21 | 1.17196 | ▲ Upward |
| 2026-01-20 | 1.17268 | ▲ Upward |
| 2026-01-19 | 1.1646 | ▼ Downward |
| 2026-01-18 | 1.16326 | ▼ Downward |
| 2026-01-16 | 1.15988 | ▼ Downward |
| 2026-01-15 | 1.16094 | ⚖️ Sideways |
| 2026-01-14 | 1.16454 | ▲ Upward |
The EMA calculations suggest a dominant upward trend recently, bolstered by short-term recoveries. Technical analysis indicates positive momentum.
Support and Resistance
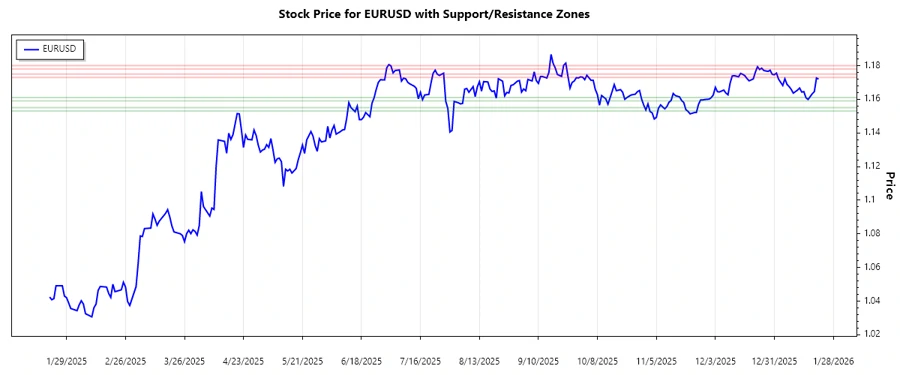
Below are the identified support and resistance zones, highlighting key levels of interest.
| Zone | From | To |
|---|---|---|
| Support Zone 1 | 1.1590 | 1.1610 |
| Support Zone 2 | 1.1530 | 1.1550 |
| Resistance Zone 1 | 1.1730 | 1.1750 |
| Resistance Zone 2 | 1.1780 | 1.1800 |
The current price is flirting with the lower boundary of the first resistance zone, suggesting potential room for either a breakout or a reversal.
Conclusion
The EURUSD pair exhibits mixed signals, with current trends more upwardly inclined despite intermittent corrections. Recognizing support and resistance levels aids in strategic positioning for potential breakouts or retracements. While the upside potential seems promising, vigilance for resistance encounters and global economic cues remains essential. Overall, a balanced approach considering both technical indicators and economic fundamentals is recommended to optimize trading outcomes.