July 19, 2025 a 04:28 am
EURUSD: Trend and Support & Resistance Analysis
The EURUSD currency pair has demonstrated significant movements in recent months, showing a subtle bullish recovery from previous lows. Current analysis indicates a technical upward trend, backed by momentum in economic indicators. However, investors should carefully monitor market uncertainties which could affect currency strength.
Trend Analysis
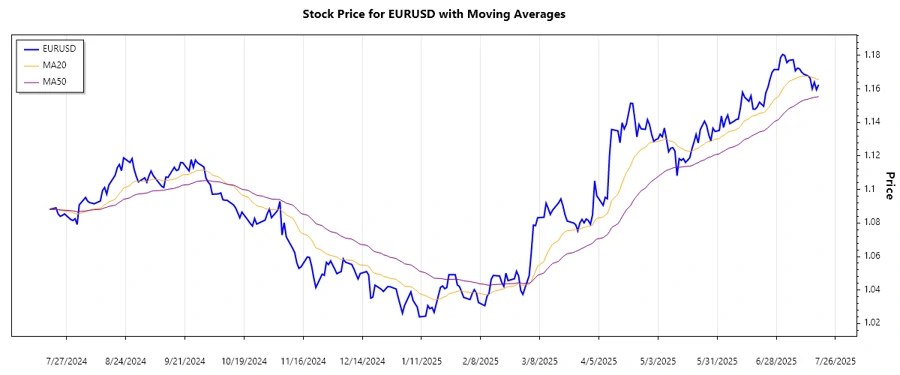
The recent historical data for the EURUSD demonstrates a recovery from the range of 1.11800 seen in June to the current figure of 1.16251. The calculated EMA20 is greater than the EMA50, signifying an ▲ upward trend.
| Date | Close | Trend |
|---|---|---|
| 2025-07-18 | 1.16251 | ▲ |
| 2025-07-17 | 1.1595 | ▲ |
| 2025-07-16 | 1.16399 | ▲ |
| 2025-07-15 | 1.16009 | ▲ |
| 2025-07-14 | 1.16641 | ▲ |
| 2025-07-13 | 1.16783 | ▲ |
| 2025-07-11 | 1.16883 | ▲ |
With EMA values supporting an upward trajectory, the EURUSD is experiencing bullish momentum.
Support and Resistance
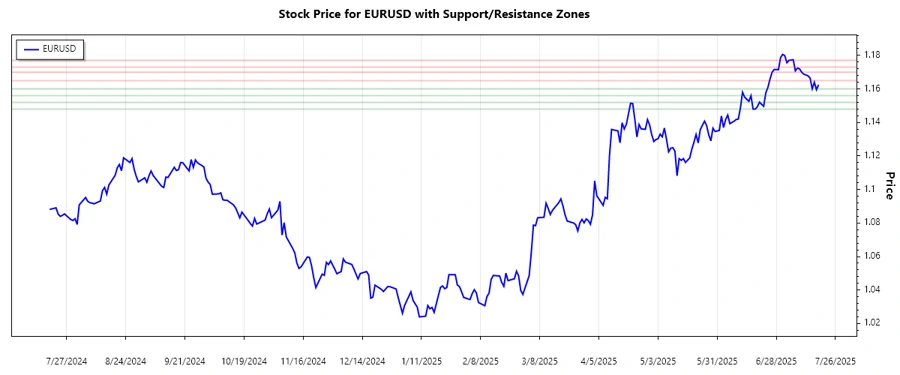
Based on the historical data, notable support and resistance zones have been identified. Crucial support is around 1.14800 - 1.15200, while resistance lies between 1.16500 - 1.17000.
| Zone Type | From | To | Direction |
|---|---|---|---|
| Support Zone | 1.14800 | 1.15200 | ⤊ |
| Support Zone | 1.15600 | 1.16000 | ⤊ |
| Resistance Zone | 1.16500 | 1.17000 | ⤋ |
| Resistance Zone | 1.17300 | 1.17700 | ⤋ |
Currently, the EURUSD is testing the higher resistance zone, suggesting limited upside potential unless a breakout occurs.
Conclusion
The EURUSD is currently positioned in an upward trend, supported by a bullish crossover of EMAs, pushing through previous resistance levels. While economic indicators bolster the euro, risks persist from external market factors. Investors must remain vigilant for possible pullbacks or consolidation within the identified resistance areas.
Smart Data Insight
Master the Perfect Entry & Exit for this Stock
Don't leave your profits to chance. Historically, this stock follows specific seasonal patterns that institutional traders use to maximize returns.
- ✅ Identify the "Golden Buying Window"
- ✅ Avoid high-risk correction cycles
- ✅ Backtested data from the last 20+ years