June 22, 2025 a 04:28 am


EURUSD: Trend and Support & Resistance Analysis
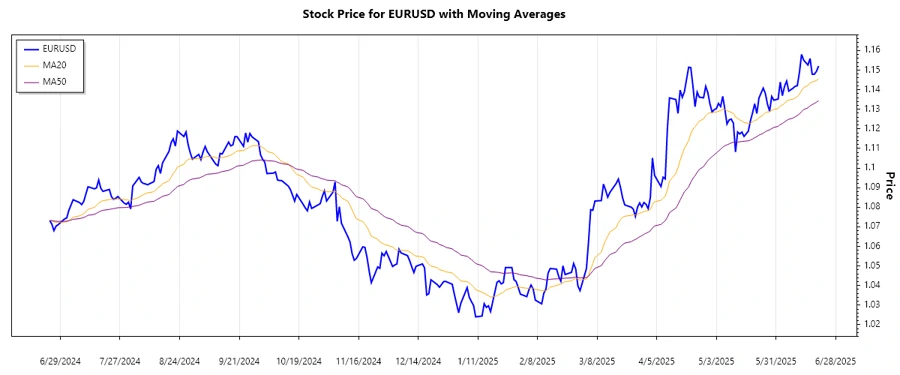
The EURUSD currency pair has displayed notable fluctuations over recent months. Technical indicators suggest a combination of strong trends and critical support and resistance levels. Understanding these patterns is essential for making informed trading decisions.
Trend Analysis
The analysis of the EURUSD based on the 20-day and 50-day Exponential Moving Averages (EMA) provides significant insights into the prevailing trend. The calculations reveal a clear trend direction based on recent price movements.
| Date | Close Price | Trend |
|---|---|---|
| 2025-06-20 | 1.15211 | ▲ Uptrend |
| 2025-06-19 | 1.14935 | ▲ Uptrend |
| 2025-06-18 | 1.14791 | ▲ Uptrend |
| 2025-06-17 | 1.14793 | ▲ Uptrend |
| 2025-06-16 | 1.15593 | ▲ Uptrend |
| 2025-06-15 | 1.15262 | ▲ Uptrend |
| 2025-06-13 | 1.15510 | ▲ Uptrend |
The EMA20 is consistently above the EMA50 over the past week, indicating a dominant uptrend. This suggests a potential continuation of positive momentum, making it an attractive setup for bullish traders.
Support and Resistance
Identifying support and resistance zones is crucial for determining potential turning points in market trends. Based on the recent price data, these zones have been calculated to guide traders.
| Zone Type | Start | End |
|---|---|---|
| Support | ⬇️ 1.1150 | 1.1250 |
| Support | ⬇️ 1.1300 | 1.1400 |
| Resistance | ⬆️ 1.1550 | 1.1650 |
| Resistance | ⬆️ 1.1700 | 1.1800 |
The current price is approaching the first resistance zone, indicating potential price action reversals or breakouts. Traders should monitor these levels closely.
Conclusion
In conclusion, the EURUSD demonstrates a promising upward trend with established support and resistance zones. While the uptrend presents opportunities for profit, the proximity to resistance levels warrants caution. Traders should consider both trend strength and potential reversals in their strategies.
Smart Data Insight
Master the Perfect Entry & Exit for this Stock
Don't leave your profits to chance. Historically, this stock follows specific seasonal patterns that institutional traders use to maximize returns.
- ✅ Identify the "Golden Buying Window"
- ✅ Avoid high-risk correction cycles
- ✅ Backtested data from the last 20+ years