
May 30, 2026 a 05:08 am
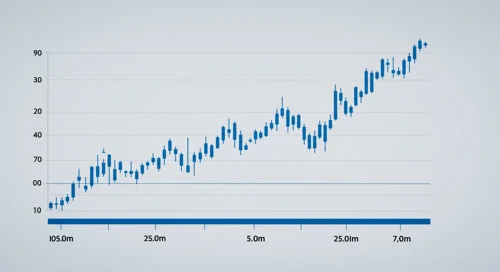

EURUSD: Fibonacci Analysis
The EURUSD has been experiencing significant volatility over the recent months. With fluctuations driven by macroeconomic events and shifts in market sentiment, understanding the currency's current position within the broader trend is crucial for traders. The recent data indicates that the currency pair is trending downward after undergoing an initial phase of consolidation.
Fibonacci Analysis
In the analyzed period, a dominant downtrend has been identified. Starting from a high point in early February to the current lower levels, the EURUSD trend highlights clear retracement levels. By calculating the Fibonacci Retracement levels, traders can pinpoint potential areas of support and resistance.
| Trend Start Date | Trend End Date | High Price (Date) | Low Price (Date) | Current Price |
|---|---|---|---|---|
| 2026-01-27 | 2026-05-29 | 1.20409 (2026-01-27) | 1.151 (2026-04-05) | 1.16621 |
| Fibonacci Level | Price Level |
|---|---|
| 23.6% | 1.16493 |
| 38.2% | 1.17264 |
| 50.0% | 1.17755 |
| 61.8% | 1.18246 |
| 78.6% | 1.18847 |
Currently, the EURUSD is trading slightly above the 23.6% Fibonacci level, suggesting a partial retracement within the downtrend. If the price continues to hold above this level, it might serve as a short-term support, yet the larger trend remains bearish. Traders should monitor these levels for possible reversals or continuation patterns.
Conclusion
In conclusion, the EURUSD remains in a bearish trend with recent retracements indicating temporary stabilization. Investors must consider the implications of ongoing economic factors which may either bolster or weaken the Euro. The technical levels provided by Fibonacci retracement offer key insights into potential future movements. It is essential for market participants to stay alert to economic data releases that could significantly alter the currency pair's trajectory. Maintaining a balanced approach to risk is advised.
Smart Data Insight
Master the Perfect Entry & Exit for this Stock
Don't leave your profits to chance. Historically, this stock follows specific seasonal patterns that institutional traders use to maximize returns.
- ✅ Identify the "Golden Buying Window"
- ✅ Avoid high-risk correction cycles
- ✅ Backtested data from the last 20+ years