August 10, 2025 a 05:08 am

EURUSD: Fibonacci Analysis
The EURUSD pair has recently shown a significant upward trend, indicating a stronger Euro against the US Dollar. This movement reflects broader economic indicators, with potential implications for investors looking to capitalize on currency fluctuations. A detailed Fibonacci analysis can shed light on potential support and resistance levels crucial for future trades.
Fibonacci Analysis
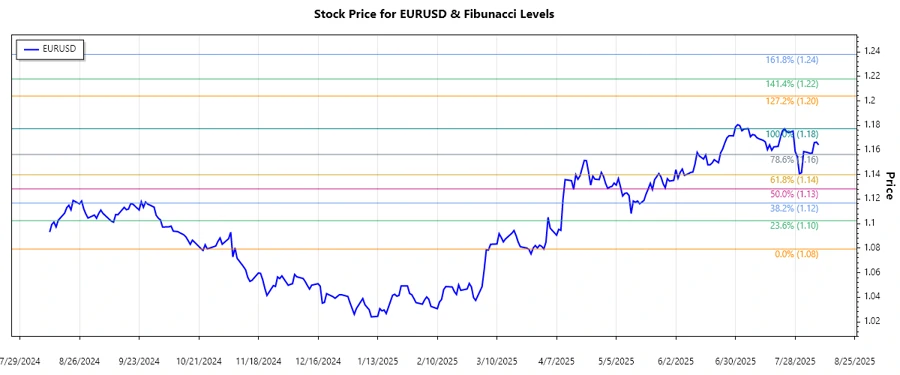
The EURUSD has been in a clear uptrend from its low on April 1, 2025, at 1.07925 to its recent high on July 23, 2025, at 1.1773. Using these pivotal points, we can calculate the Fibonacci retracement levels to predict potential price pullbacks and assess the strength of this trend.
| Fibonacci Level | Price Level |
|---|---|
| 0.236 | 1.1542 |
| 0.382 | 1.1427 |
| 0.5 | 1.1283 |
| 0.618 | 1.1139 |
| 0.786 | 1.0949 |
As of the latest data, with a price of 1.16416 on August 8, 2025, the EURUSD is situated just above the 0.236 Fibonacci level. This positioning suggests a potential support zone, where traders expect the price might experience buying interest, indicating a continuation of the uptrend.
From a technical perspective, the current level may act as a support. Should the price breach this level, it would target the next Fibonacci level at 1.1427, marking 0.382. Traders may consider this a critical juncture, potentially shifting the bullish outlook.
Conclusion
The EURUSD's ascent presents opportunities for investors favoring long positions, contingent upon maintaining current support. However, vigilance is urged as geopolitical and economic fluctuations might abruptly alter current trajectories. Effective risk management remains paramount while eyeing potential pullbacks toward the 0.382 retracement level, which could significantly influence future market directions.
Smart Data Insight
Master the Perfect Entry & Exit for this Stock
Don't leave your profits to chance. Historically, this stock follows specific seasonal patterns that institutional traders use to maximize returns.
- ✅ Identify the "Golden Buying Window"
- ✅ Avoid high-risk correction cycles
- ✅ Backtested data from the last 20+ years