
June 07, 2026 a 04:28 am

EURNZD: Trend and Support & Resistance Analysis
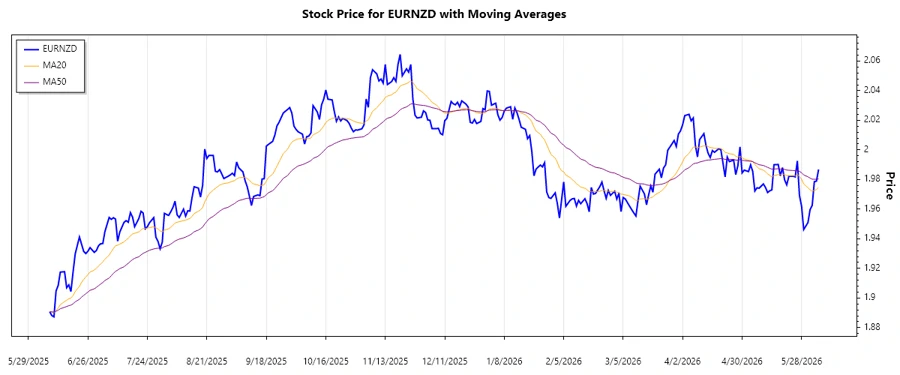
The EURNZD currency pair has demonstrated a mix of trends with fluctuations over the observed period. Recent data indicate a potential upward momentum, although volatility remains a consideration. Traders should be cautious and watch for confirmatory signals if considering positioning on this pair. Close monitoring of key support and resistance levels is advised for effective risk management.
Trend Analysis
The technical analysis of EURNZD based on the recent closing prices shows varied dynamics in the currency pair. Calculating the EMA20 and EMA50 indicates that the EMA20 has recently surpassed the EMA50, signaling a potential ▲ upward trend. The price movements in the last seven days show a trend direction that is pivotal for ongoing trading strategies.
| Date | Closing Price | Trend |
|---|---|---|
| 2026-06-05 | 1.98682 | ▲ |
| 2026-06-04 | 1.97892 | ▲ |
| 2026-06-03 | 1.97857 | ▲ |
| 2026-06-02 | 1.96258 | ▼ |
| 2026-06-01 | 1.95972 | ▼ |
| 2026-05-31 | 1.95095 | ▼ |
| 2026-05-29 | 1.94622 | ▼ |
The observed upward movement in EMA suggests positive sentiment, yet vigilance is needed given recent volatility. The trend shows potential buying opportunities, with price levels trending upward.
Support and Resistance
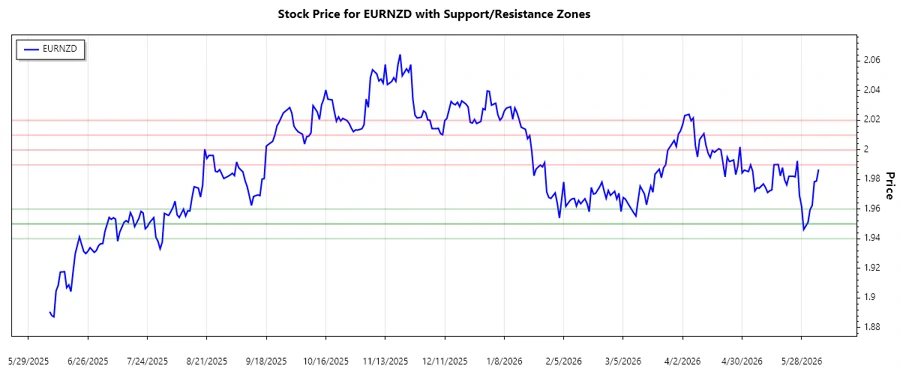
An analysis of support and resistance levels based on the closing prices has identified key zones where price interactions are most likely. Traders should note these levels to forecast potential price reversals.
| Zone Type | From | To |
|---|---|---|
| Support | 1.95000 | 1.96000 |
| Support | 1.94000 | 1.95000 |
| Resistance | 1.99000 | 2.00000 |
| Resistance | 2.01000 | 2.02000 |
Currently, the price is traversing near the higher support zone of 1.95000 to 1.96000. This precedence suggests potential support for upward movements, yet price consolidation is necessary for confirming further trends.
Conclusion
The EURNZD has potential for upward trends, capitalized by breaking through EMA levels. The currency pair remains attractive with promising technical setups, albeit cautious appreciation for historical volatilities is advised. Monitor closely for confirmatory signals around critical support and resistance to reinforce trading decisions. Effective risk assessments will govern trading success with this pair. Adverse movements require prompt strategic adjustments.
Smart Data Insight
Master the Perfect Entry & Exit for this Stock
Don't leave your profits to chance. Historically, this stock follows specific seasonal patterns that institutional traders use to maximize returns.
- ✅ Identify the "Golden Buying Window"
- ✅ Avoid high-risk correction cycles
- ✅ Backtested data from the last 20+ years