March 04, 2026 a 04:28 am


EURNZD: Trend and Support & Resistance Analysis
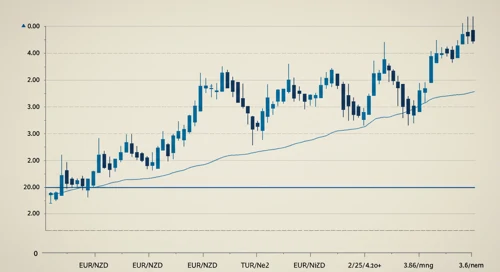
The EURNZD currency pair has shown considerable fluctuations over the past few months. An examination of the exponential moving averages indicates a general downward pressure, though not without temporary upward reversals. These dynamics are essential for traders looking to identify strategic trading opportunities based on support and resistance levels.
Trend Analysis
| Date | Closing Price | Trend |
|---|---|---|
| 2026-03-04 | 1.96672 | ▼ Downward |
| 2026-03-03 | 1.97077 | ▼ Downward |
| 2026-03-02 | 1.96683 | ▼ Downward |
| 2026-03-01 | 1.97207 | ▲ Upward |
| 2026-02-27 | 1.96933 | ▼ Downward |
| 2026-02-26 | 1.97264 | ▲ Upward |
| 2026-02-25 | 1.96725 | ▼ Downward |
The EMA20 has consistently been below the EMA50, indicating a persistent downward trend over recent data points. This signals potential shorting opportunities, albeit with caution as occasional bullish corrections may occur.
Support and Resistance
| Zone Type | Zone Range |
|---|---|
| Support Zone 1 | 1.9540 - 1.9720 |
| Support Zone 2 | 1.9300 - 1.9450 |
| Resistance Zone 1 | 1.9900 - 2.0050 |
| Resistance Zone 2 | 2.0150 - 2.0300 |
The current trading price seems to fluctuate within the primary support zone. This suggests potential buying interest at these levels, while resistance areas may inhibit an upward break. Traders should watch for fundamental shifts or high-volume moves for any breakthrough.
Conclusion
The analysis of the EURNZD reveals a market that is currently under pressure with long-term bearish tendencies. Active traders may capitalize on these trends by considering short positions as the price remains below key moving averages. However, watch for any geopolitical or economic news that may influence currency fluctuations, impacting trading strategies.