January 30, 2026 a 04:28 am

EURNZD: Trend and Support & Resistance Analysis
The EURNZD currency pair has exhibited significant volatility in recent months, with various ups and downs. Recently, there has been a noticeable shift in trend direction, as observed in the moving averages. This analysis seeks to clarify the current market sentiment and provide insights into potential support and resistance levels that could guide trading strategies. This detailed evaluation will aid in understanding the current price behaviors and future market possibilities.
Trend Analysis
After initiating a calculation of the 20-day and 50-day Exponential Moving Averages (EMA) from the closing prices, the recent trend can be identified. Over the last couple of weeks, up until the most recent data on January 30, 2026, the EMA20 is diverging from the EMA50, indicating a downward trend has formed in the past few days.
| Date | Close | Trend |
|---|---|---|
| 2026-01-30 | 1.97165 | ▼ |
| 2026-01-29 | 1.96784 | ▼ |
| 2026-01-28 | 1.97157 | ▼ |
| 2026-01-27 | 1.99139 | ▲ |
| 2026-01-26 | 1.98854 | ▲ |
| 2026-01-25 | 1.9898 | ▲ |
| 2026-01-23 | 1.98707 | ▲ |
The current technical indications suggest a prevailing bearish trend as the EMA20 moves below the EMA50.
Support and Resistance
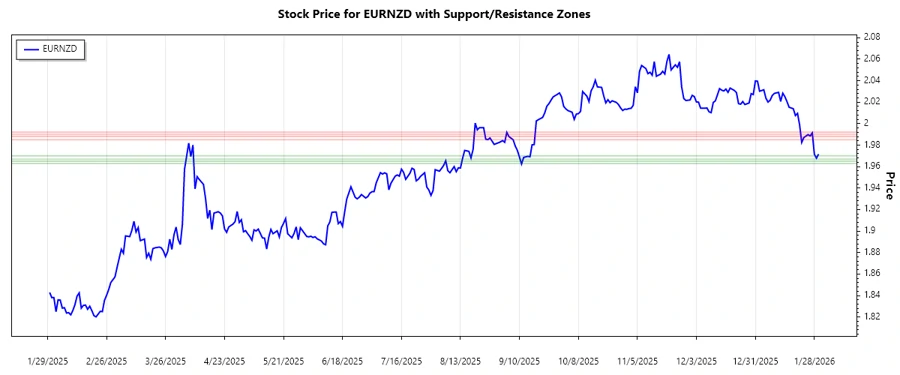
An analysis of recent price levels has identified key support and resistance zones for EURNZD:
| Zone | Price Range |
|---|---|
| Support 1 | 1.9670 - 1.9700 |
| Support 2 | 1.9630 - 1.9650 |
| Resistance 1 | 1.9850 - 1.9880 |
| Resistance 2 | 1.9900 - 1.9920 |
The current price appears to be testing the lower boundary of the first resistance zone. Given this, traders should look for indications of reversal or continuation patterns.
Conclusion
The overall analysis indicates a transition towards a bearish market, with the EMA20 moving below the EMA50, strengthening the view of sustained downward momentum. The identified support and resistance zones could play a critical role in determining future price behaviors. While the price tests resistance levels, careful observation for any bullish reversal signals is crucial. The interplay between these identified zones may offer trading opportunities, amidst broader market volatility. Caution is advised given the current trend, but opportunities for profit exist with strategic positioning. Analysts should continuously evaluate these dynamics in real-time for optimal decision-making.