April 29, 2026 a 05:08 am
EURNZD: Fibonacci Analysis
The EURNZD currency pair has experienced significant movements in recent months, showcasing various market dynamics. An upward momentum has been identified, suggesting a generally bullish sentiment in the market. Traders should remain vigilant as shifts in the economic landscape may impact the Euro and New Zealand dollar's relative strength, influencing their exchange rates. Maintaining awareness of geopolitical factors and central bank policies is crucial when analyzing this pair's future trajectory.
Fibonacci Analysis
A comprehensive examination of the recent trends in the EURNZD reveals an upward movement. By analyzing data, potential support and resistance levels can be identified to guide trading decisions. Here is the detailed breakdown, including the Fibonacci retracement levels and technical implications.
| Data Analysis | Details |
|---|---|
| Trend Start Date | 2025-11-25 |
| Trend End Date | 2026-04-29 |
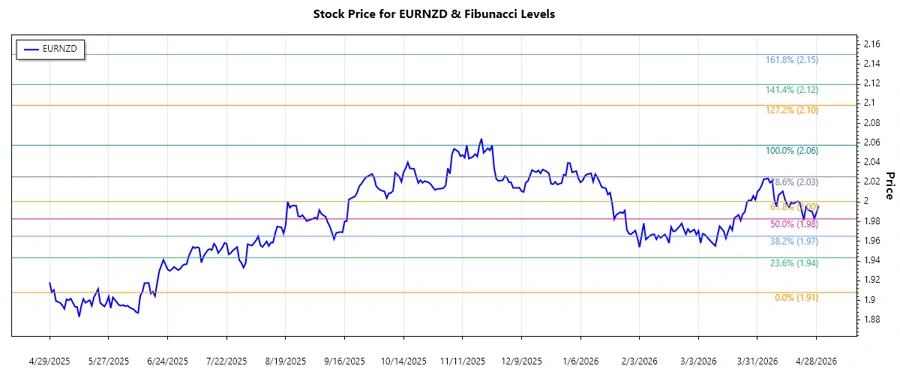
| High Point (Date & Price) | 2025-11-25, $2.05768 |
| Low Point (Date & Price) | 2025-04-30, $1.90803 |
| Current Price | $1.99608 |
| Fibonacci Level | Price |
|---|---|
| 0.236 | $1.93889 |
| 0.382 | $1.95691 |
| 0.5 | $1.97746 |
| 0.618 | $1.99801 |
| 0.786 | $2.02394 |
The current price is near the 0.618 retracement level, indicating the possibility of resistance. Traders may consider this level as a potential barrier for further upward movement.
Conclusion
In summary, the recent upward trend in the EURNZD pair highlights a potential bullish opportunity. However, the presence of the current price near the 0.618 Fibonacci retracement level suggests caution due to potential resistance. Analysts should keep a keen eye on market indicators and news that might inform longer-term decisions. Notably, any breach above or pattern formation near this critical level could either affirm resistance or usher in new bullish opportunities. As always, a balanced evaluation of technical and fundamental aspects remains key to navigating the complexities of the forex market.