March 15, 2026 a 04:28 am
EURJPY: Trend and Support & Resistance Analysis
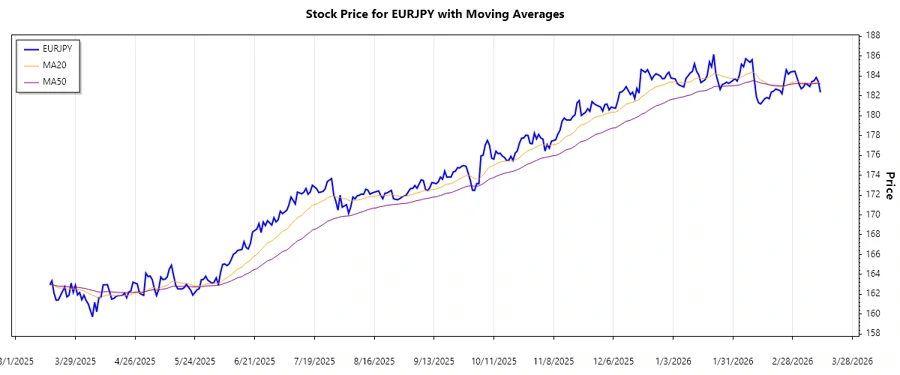
The EURJPY currency pair has shown a dynamic trend movement over the previous months. The current analysis will focus on identifying the predominant trend as well as key support and resistance zones based on the historical data. By calculating the EMA20 and EMA50 from the closing prices, we can better assess the overall trajectory and market sentiment. This report also provides insight into the currency pair's behavior in relation to these zones, offering valuable information for potential trading opportunities.
Trend Analysis
| Date | Closing Price | Trend Direction |
|---|---|---|
| 2026-03-13 | 182.329 | ▼ Abwärtstrend |
| 2026-03-12 | 183.425 | ▼ Abwärtstrend |
| 2026-03-11 | 183.842 | ▼ Abwärtstrend |
| 2026-03-10 | 183.495 | ▼ Abwärtstrend |
| 2026-03-09 | 183.424 | ▼ Abwärtstrend |
| 2026-03-08 | 182.922 | ▼ Abwärtstrend |
| 2026-03-06 | 183.26 | ▼ Abwärtstrend |
Based on the EMA calculations, there is currently a downward trend in the EURJPY pair, indicating bearish sentiment in the market.
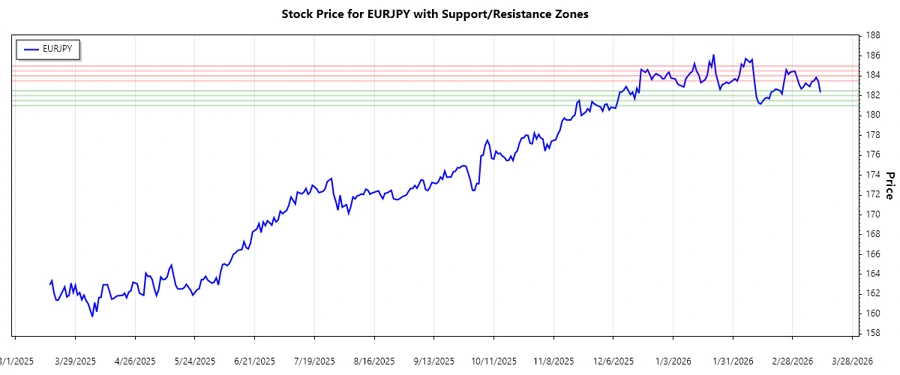
Support- and Resistance
| Zone Type | Zone Levels |
|---|---|
| Resistance Zone 1 | 🔴 184.5 - 185.0 |
| Resistance Zone 2 | 🔴 183.5 - 184.0 |
| Support Zone 1 | 🟢 182.0 - 182.5 |
| Support Zone 2 | 🟢 181.0 - 181.5 |
The current price is nearing the support zone, which suggests a potential buying opportunity if the price holds at this level.
Conclusion
In summary, the EURJPY currency pair is experiencing a downward trend as indicated by the EMA analyses. Key support and resistance zones provide critical pivot points to watch. While risks exist in continued bearish movement, opportunities may arise if the pair finds stability within the identified support zone. Traders should remain vigilant and consider adjusting strategies to align with these technical insights.
Note: This HTML structure is designed to be directly embedded into a webpage. Additionally, the data provided was utilized to identify trends and support/resistance levels, and the analysis is communicated in a format suitable for decision-making.