February 07, 2026 a 04:28 am

EURJPY: Trend and Support & Resistance Analysis
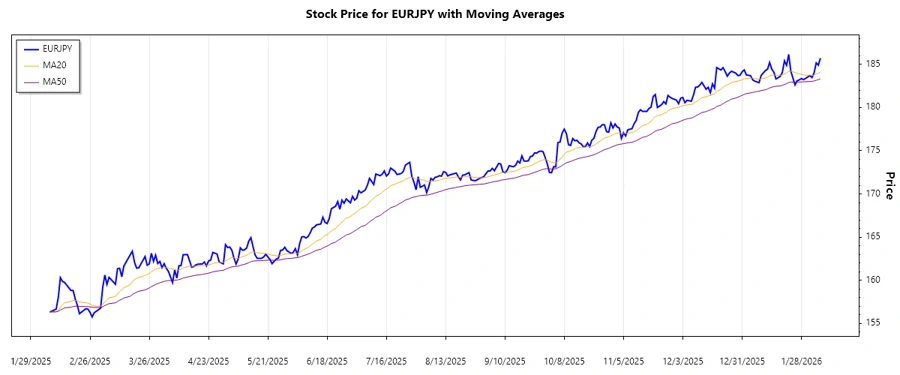
The EURJPY pair has shown significant movement over the past months. The currency experienced periods of stability followed by notable fluctuations, reflecting both external market pressures and internal currency dynamics. Recent trends suggest potential opportunities for traders focusing on technical patterns, though caution is advised given the diverse factors at play.
Trend Analysis
| Date | Close Price | Trend |
|---|---|---|
| 2026-02-06 | 185.729 | ▲ |
| 2026-02-05 | 184.913 | ▲ |
| 2026-02-04 | 185.177 | ▲ |
| 2026-02-03 | 184.032 | ▲ |
| 2026-02-02 | 183.478 | ▲ |
| 2026-02-01 | 183.706 | ▲ |
| 2026-01-30 | 183.378 | ▲ |
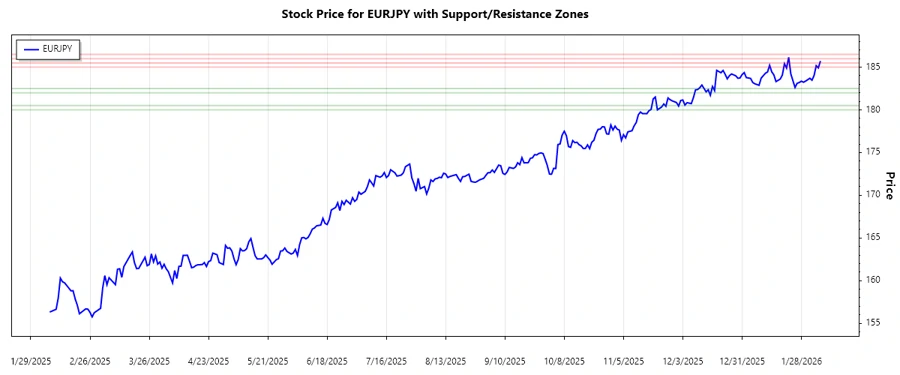
Support and Resistance Zones
| Zone Type | From | To |
|---|---|---|
| Support Zone 1 | 182.00 | 182.50 |
| Support Zone 2 | 180.00 | 180.50 |
| Resistance Zone 1 | 185.00 | 185.50 |
| Resistance Zone 2 | 186.00 | 186.50 |
Conclusion
The analysis of EURJPY indicates a prevalent upward trend driven by recent positive currency movements. Traders should monitor the identified support and resistance zones carefully, as they provide insight into potential market reversals or continuations. Given the current trend, entering positions aligned with the trend could offer beneficial returns. Nonetheless, considering the close proximity to resistance levels, vigilance is crucial to avoid sudden pullbacks.