December 21, 2025 a 04:28 am
EURJPY: Trend and Support & Resistance Analysis
The EURJPY currency pair has shown volatility in the recent months, with noticeable movements in both directions. Currently, the technical indicators suggest a dominant upward trend, driven by a consistent increase in closing prices. Support and resistance levels are well-defined, providing traders with strategic points for potential entries and exits.
Trend Analysis
| Date | Close Price | Trend |
|---|---|---|
| Dec 19, 2025 | 184.632 | ▲ Upward |
| Dec 18, 2025 | 182.255 | ▲ Upward |
| Dec 17, 2025 | 182.744 | ▲ Upward |
| Dec 16, 2025 | 181.717 | ▲ Upward |
| Dec 15, 2025 | 182.351 | ▲ Upward |
| Dec 14, 2025 | 182.119 | ▲ Upward |
| Dec 12, 2025 | 182.914 | ▲ Upward |
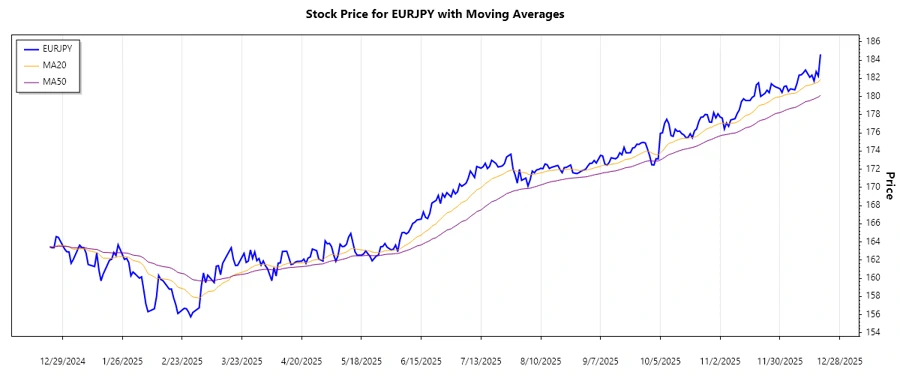
The EMA20 remains consistently above the EMA50, indicating a sustained upward trend. Traders might consider taking long positions as the trend continues.
Support and Resistance
| Zone | Level |
|---|---|
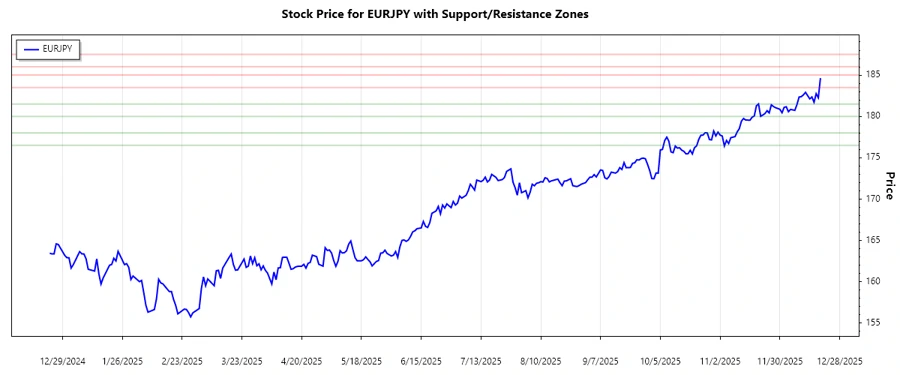
| Support 1 | 176.50 - 178.00 |
| Support 2 | 180.00 - 181.50 |
| Resistance 1 | 183.50 - 185.00 |
| Resistance 2 | 186.00 - 187.50 |
The current price is nearing the resistance zone between 183.50 and 185.00. Traders should watch for potential reversals or breakthroughs at these levels, as they are critical in defining future price action.
Conclusion
The EURJPY analysis suggests a bullish outlook given the rising trend and proximity to resistance levels. Traders need to monitor these zones for signs of reversals or potential breakouts. The strong upward trend provides opportunities for gaining profit, but caution is advised near resistance levels to prevent reversals. Further volatility in the currency pair should be anticipated, requiring adaptive strategies for optimally responding to market changes.