September 26, 2025 a 04:28 am
EURJPY: Trend and Support & Resistance Analysis
The EURJPY currency pair has shown significant movements recently. Understanding the current trend and identifying key support and resistance zones is crucial for traders. It appears that a pattern is beginning to establish itself, providing both opportunities and challenges for market participants.
Trend Analysis
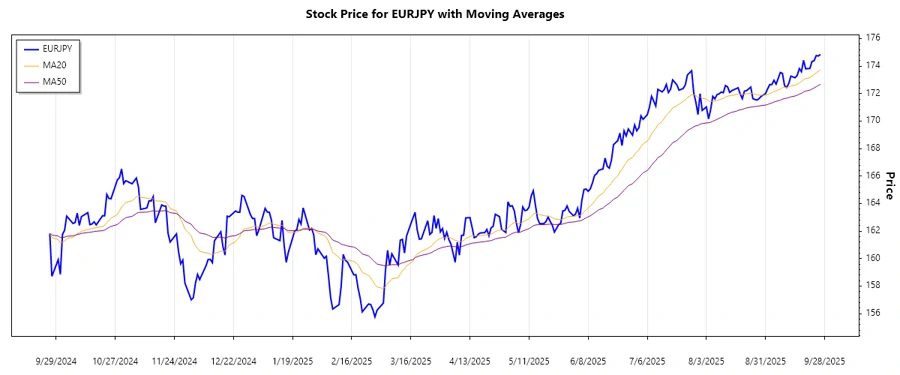
The analysis of the EURJPY's recent price movements reveals a stronger trending phase. Calculating the EMA for the recent closing prices allows us to identify the prevailing market direction.
| Date | Close Price | Trend |
|---|---|---|
| 2025-09-26 | 174.844 | ▲ ▲ Uptrend |
| 2025-09-25 | 174.727 | ▲ ▲ Uptrend |
| 2025-09-24 | 174.757 | ▲ ▲ Uptrend |
| 2025-09-23 | 174.388 | ▲ ▲ Uptrend |
| 2025-09-22 | 174.331 | ▲ ▲ Uptrend |
| 2025-09-21 | 173.823 | ▲ ▲ Uptrend |
| 2025-09-19 | 173.796 | ▲ ▲ Uptrend |
The analysis indicates a dominant ▲ Uptrend where EMA20 > EMA50, suggesting a bullish market sentiment.
Support- and Resistance
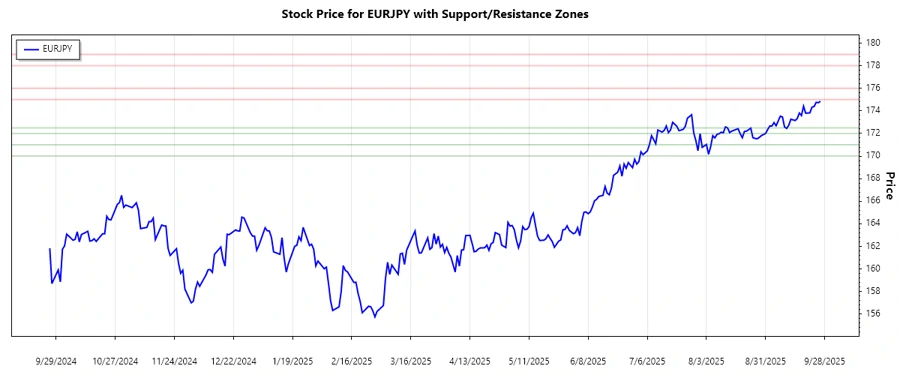
A thorough examination highlights key support and resistance levels crucial for EURJPY's trading strategy.
| Zone Type | From | To |
|---|---|---|
| Support Zone 1 | 172.00 | 172.50 |
| Support Zone 2 | 170.00 | 171.00 |
| Resistance Zone 1 | 175.00 | 176.00 |
| Resistance Zone 2 | 178.00 | 179.00 |
The current price is hovering close to a resistance zone, indicating potential reversal or breakout points.
Conclusion
The EURJPY shows a notable ▲ Uptrend, backed by consistent movements above EMA indicators. While opportunities for gains are substantial, the proximity to resistance zones signals caution. Traders should guard against potential reversals while positioning themselves for potential breakouts. A balanced approach that includes monitoring market sentiments can help navigate this volatile environment.
Smart Data Insight
Master the Perfect Entry & Exit for this Stock
Don't leave your profits to chance. Historically, this stock follows specific seasonal patterns that institutional traders use to maximize returns.
- ✅ Identify the "Golden Buying Window"
- ✅ Avoid high-risk correction cycles
- ✅ Backtested data from the last 20+ years