July 03, 2025 a 04:28 am
EURJPY: Trend and Support & Resistance Analysis
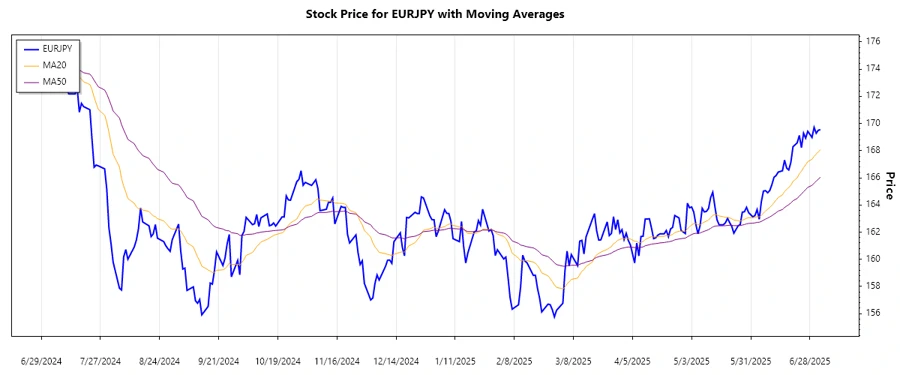
EURJPY has demonstrated significant volatility over the past few months, presenting both opportunities and risks for traders. The currency pair appears to have shifted from a period of decline to a more bullish outlook recently. Observing the exponential moving averages, the pair has shown signs of potential continued growth. However, key support and resistance zones must be monitored closely to navigate any potential reversals. Understanding these zones can inform strategic entry and exit points.
Trend Analysis
| Date | Closing Price | Trend |
|---|---|---|
| 2025-07-03 | 169.534 | ▲ Upward |
| 2025-07-02 | 169.503 | ▲ Upward |
| 2025-07-01 | 169.278 | ▲ Upward |
| 2025-06-30 | 169.714 | ▲ Upward |
| 2025-06-29 | 168.969 | ▲ Upward |
| 2025-06-27 | 169.421 | ▲ Upward |
| 2025-06-26 | 168.917 | ▲ Upward |
The EURJPY currency pair has shown a consistent upward trend over the past week. With the EMA20 exceeding the EMA50, this indicates a bullish momentum.
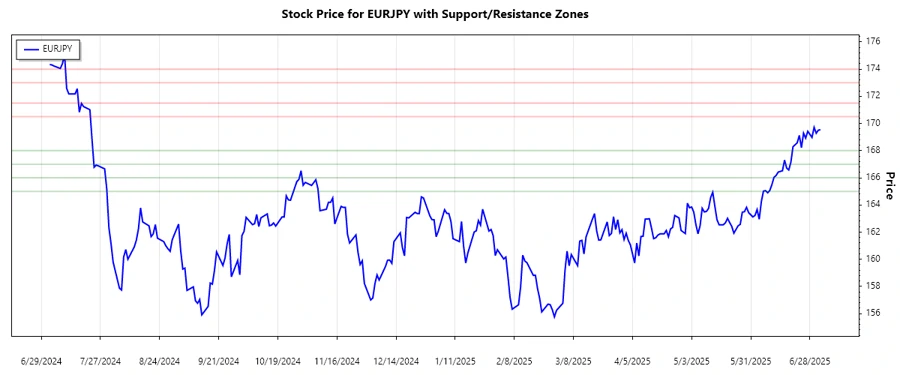
Support- and Resistance
| Zone Type | From | To |
|---|---|---|
| Support | 167.00 | 168.00 |
| Support | 165.00 | 166.00 |
| Resistance | 170.50 | 171.50 |
| Resistance | 173.00 | 174.00 |
Currently, the EURJPY pair is hovering near a resistance zone. Traders should watch closely to see if it breaks above, indicating a potential for further upward movement. If it fails, it could test the lower support zones.
Conclusion
In conclusion, the EURJPY currency pair has shown a significant upward trend, supported by the bullish EMA crossover. Traders are advised to monitor the nearby resistance zones, as breaking through could imply additional gains. However, if resistance holds, a retracement to support levels could occur. The key challenge remains managing potential pullbacks and market unpredictability. Overall, while the upward momentum is encouraging, vigilance is required to adapt to possible trend corrections in the near future.