May 20, 2025 a 04:28 am


EURJPY: Trend and Support & Resistance Analysis
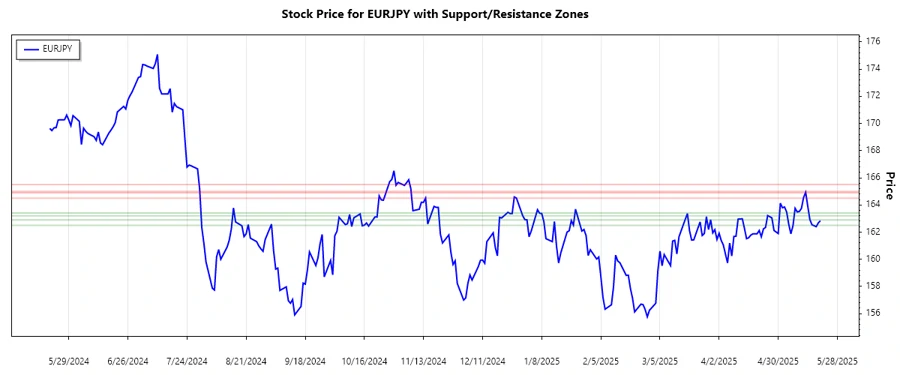
The EURJPY currency pair has shown notable volatility over recent months. Currently, the trend analysis presents a mixed picture with key indicators suggesting potential turning points. Both support and resistance levels are tightly contested, dictating the currency pair's short-term movement.
Trend Analysis
A detailed study of the EURJPY reveals fluctuations between upward and downward inclinations. Using the EMA20 and EMA50 indicators, we can observe:
| Date | Close Price | Trend |
|---|---|---|
| 2025-05-14 | 163.895 | ▲ Up |
| 2025-05-15 | 162.915 | ▼ Down |
| 2025-05-16 | 162.537 | ▼ Down |
| 2025-05-18 | 162.399 | ⚖️ Sideways |
| 2025-05-19 | 162.683 | ▲ Up |
| 2025-05-20 | 162.835 | ▲ Up |
The trend reflects a predominantly upward trend with intermittent corrections. This suggests cautious optimism.
Support and Resistance
Analysis of the recent historical price data provides insight into support and resistance zones for the EURJPY currency pair.
| Type | Zone From | Zone To |
|---|---|---|
| Support Zone 1 | 162.500 | 162.900 |
| Support Zone 2 | 163.200 | 163.400 |
| Resistance Zone 1 | 164.500 | 164.900 |
| Resistance Zone 2 | 165.000 | 165.500 |
The current price level is edging closer to the established resistance zones. Thus, trading strategies should focus on potential breakouts or retracements.
Conclusion
In conclusion, the EURJPY currency pair is at a critical juncture. While it demonstrates short-term upward momentum, significant resistance levels lie ahead. Analysts must weigh these technical intimations with global economic indicators. Prospective risks are inherent in sudden currency shifts driven by macroeconomic factors. It remains pivotal for traders to remain vigilant to adjust strategies accordingly.