June 29, 2026 a 05:08 am
EURJPY: Fibonacci Analysis
The EURJPY currency pair has recently shown a significant decline, indicating a potential bearish trend. This period has seen a notable drop from its recent highs, suggesting potential market corrections or other macroeconomic influences affecting currency valuation.
Fibonacci Analysis
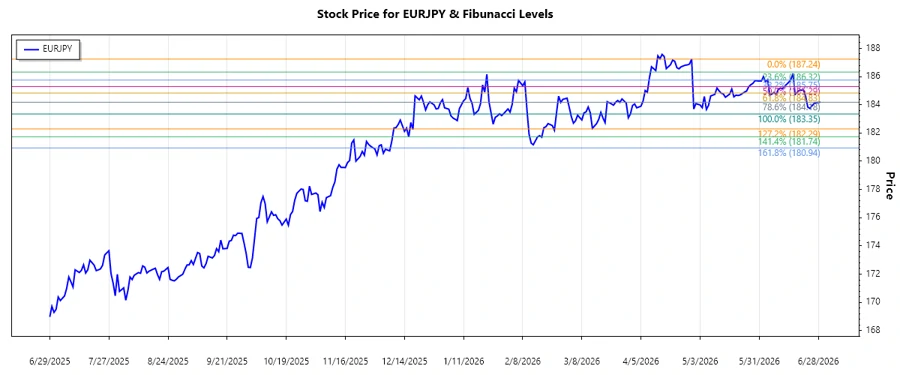
In examining the EURJPY currency pair, we observe a clear downward trend from the end of April to late June 2026. During this period, the prices fell from a high of 187.236 on April 29, 2026, to a low of 183.346 on June 29, 2026. Utilizing this trend, we calculate the following Fibonacci Retracement levels:
| Retracement Level | Price Level |
|---|---|
| 0.236 | 186.041 |
| 0.382 | 185.089 |
| 0.5 | 184.794 |
| 0.618 | 183.998 |
| 0.786 | 183.612 |
The current EURJPY price is at 184.186, currently in the 0.5–0.618 retracement zone. This suggests a potential area of support for the currency pair, which could indicate consolidation before a further move.
The broader technical outlook suggests that if the currency manages to hold this level, there could be a reversal and potential uptrend. Conversely, falling below 0.618 could lead to further decline.
Conclusion
The analysis of EURJPY reveals a bearish phase with opportunities for retracement as shown by Fibonacci levels. While the recent trend suggests caution, the currency's position within relevant retracement zones indicates potential support or a shift in momentum. Analysts must closely monitor these levels to gauge the effectiveness of current targets and possible shifts in strategy. The ongoing volatility presents both risks and opportunities for position adjustments in the coming weeks.
JSON representation:
Smart Data Insight
Master the Perfect Entry & Exit for this Stock
Don't leave your profits to chance. Historically, this stock follows specific seasonal patterns that institutional traders use to maximize returns.
- ✅ Identify the "Golden Buying Window"
- ✅ Avoid high-risk correction cycles
- ✅ Backtested data from the last 20+ years