December 01, 2025 a 05:08 am
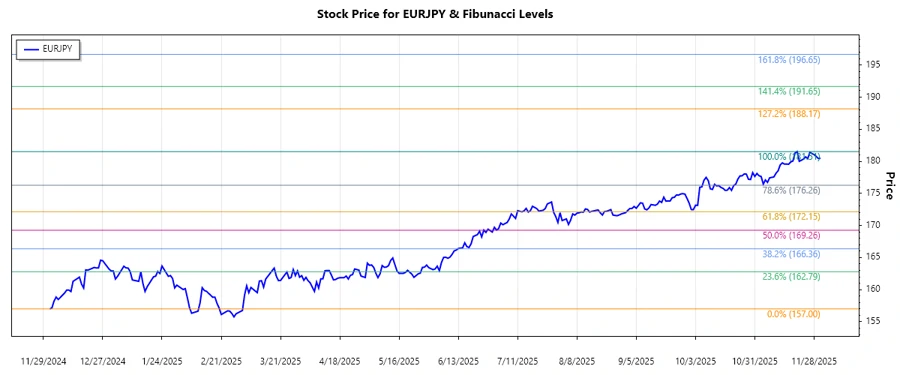
EURJPY: Fibonacci Analysis
The EURJPY has experienced significant volatility over recent months, with both upward and downward pressures influencing its trajectory. Recent trends suggest a dominant upward movement, offering potential opportunities for traders seeking to capitalize on retracement levels. Understanding these levels can provide critical insights into future price behaviors.
Fibonacci Analysis
| Detail | Value |
|---|---|
| Trend Start Date | 2024-12-02 |
| Trend End Date | 2025-12-01 |
| High Point (Price & Date) | 181.509 on 2025-11-20 |
| Low Point (Price & Date) | 157.002 on 2024-12-02 |
| Fibonacci Level | Price Level |
|---|---|
| 0.236 | 162.174 |
| 0.382 | 166.850 |
| 0.5 | 169.256 |
| 0.618 | 171.661 |
| 0.786 | 175.394 |
The current EURJPY price is approximately 180.461, placing it above the 0.786 retracement level. This suggests that the pair is currently not within a typical retracement zone, indicating continued upward momentum with potential resistances at higher fib levels.
Technically, this upward momentum suggests strong buying interest, making the current levels potential points of support rather than resistance, which may indicate further bullish potential in the short term.
Conclusion
In conclusion, the EURJPY has demonstrated a consistent upward trend since December 2024, with the price surging from the low 157s to over 181. Such momentum reflects strong bullish tendencies, presenting opportunities for traders and investors focusing on upward trends and breakout scenarios. However, with the price trading above major Fibonacci retracement levels, it is critical to consider potential market corrections. Nonetheless, the current technical setup supports sustained upward prospects, recommending vigilance for potential resistance encounters.
Smart Data Insight
Master the Perfect Entry & Exit for this Stock
Don't leave your profits to chance. Historically, this stock follows specific seasonal patterns that institutional traders use to maximize returns.
- ✅ Identify the "Golden Buying Window"
- ✅ Avoid high-risk correction cycles
- ✅ Backtested data from the last 20+ years