September 09, 2025 a 05:08 am

EURJPY: Fibonacci Analysis
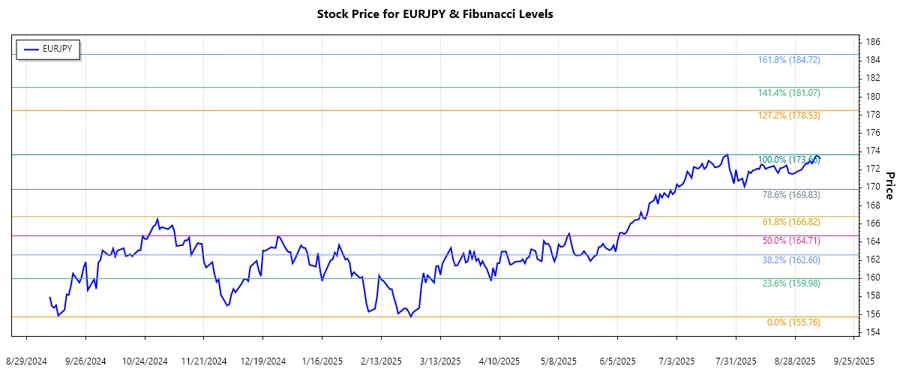
The EURJPY currency pair has been experiencing fluctuations influenced by market dynamics and economic indicators. An overall analysis indicates a prevailing uptrend with intermittent corrections. Traders should remain vigilant for potential shifts driven by macroeconomic announcements. The pair's recent highs and lows provide a foundation for a detailed Fibonacci retracement analysis.
Fibonacci Analysis
| Detail | Value |
|---|---|
| Start Date | 2025-02-19 |
| End Date | 2025-09-09 |
| High Price & Date | 173.659 on 2025-07-27 |
| Low Price & Date | 155.758 on 2025-02-27 |
| Fibonacci Level 0.236 | 159.753 |
| Fibonacci Level 0.382 | 163.211 |
| Fibonacci Level 0.5 | 166.291 |
| Fibonacci Level 0.618 | 169.371 |
| Fibonacci Level 0.786 | 173.142 |
| Current Price | 173.203 |
| Retracement Zone | none |
| Technical Interpretation | The current price surpasses major retracement levels, suggesting a continuation of the uptrend, with possible support at the 0.786 level. |
Conclusion
The EURJPY analysis reveals a robust uptrend that has been sustained over the past several months. The currency pair has exceeded key Fibonacci levels, indicating strong bullish momentum. Market participants should consider the potential for continued gains unless economic developments suggest otherwise. However, caution is advised as volatile market conditions can alter the current trajectory. The retracements and support levels provide strategic entry and exit points, essential for optimizing trade decisions. Analysts should remain attentive to economic indicators that could impact further movement in the EURJPY.
Smart Data Insight
Master the Perfect Entry & Exit for this Stock
Don't leave your profits to chance. Historically, this stock follows specific seasonal patterns that institutional traders use to maximize returns.
- ✅ Identify the "Golden Buying Window"
- ✅ Avoid high-risk correction cycles
- ✅ Backtested data from the last 20+ years