July 24, 2025 a 05:08 am
EURJPY: Fibonacci Analysis
The EURJPY has shown notable volatility in recent months, reflecting both economic shifts in Europe and Japan. As a currency pair that often mirrors market sentiment and economic fundamentals, it's a critical indicator for traders and investors alike. Observing recent trends offers insights into potential future movements.
Fibonacci Analysis
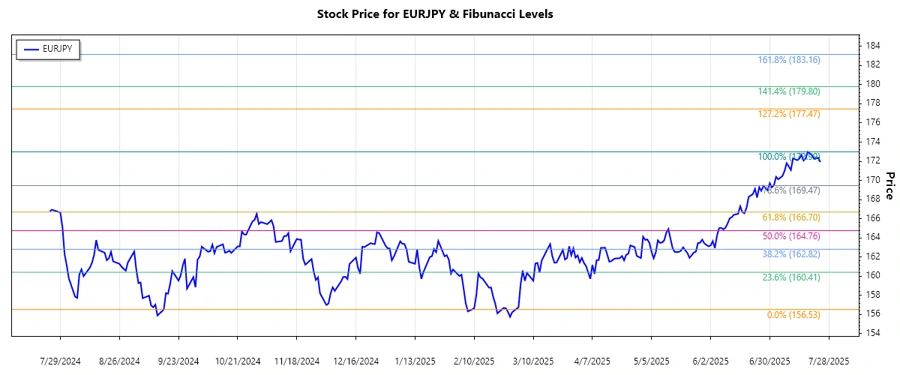
Based on the recent data analysis of EURJPY, a clear uptrend is evident starting from early March 2025 to late July 2025. The currency pair saw significant movement, with a defining high and low that set the stage for analyzing key Fibonacci levels.
| Trend Start Date | 2024-09-16 |
|---|---|
| Trend End Date | 2025-07-24 |
| High Price Date | 2025-07-18 |
| High Price | 172.988 |
| Low Price Date | 2024-09-16 |
| Low Price | 156.528 |
The calculated Fibonacci retracement levels are critical as they serve as potential areas of support and resistance:
| Fibonacci Level | Price Level |
|---|---|
| 0.236 | 161.747 |
| 0.382 | 164.207 |
| 0.5 | 166.758 |
| 0.618 | 169.308 |
| 0.786 | 172.048 |
The current trading price is approximately 171.923, suggesting that the pair is within the proximity of the 0.786 retracement level. This indicates potential resistance, where reversals may occur.
The technical interpretation of being in this region suggests the importance of close monitoring - while upward momentum persists, watch for possible retracement.
Conclusion
The analysis indicates a strong upward trend in EURJPY over recent months, with the current positioning near a significant Fibonacci level. While there are opportunities for gains within this bullish trend, potential resistance points also highlight risks of price pullbacks. Analysts should consider macroeconomic factors from both the European and Japanese markets, alongside technical indicators, for a comprehensive forecast.
Smart Data Insight
Master the Perfect Entry & Exit for this Stock
Don't leave your profits to chance. Historically, this stock follows specific seasonal patterns that institutional traders use to maximize returns.
- ✅ Identify the "Golden Buying Window"
- ✅ Avoid high-risk correction cycles
- ✅ Backtested data from the last 20+ years