June 24, 2026 a 04:28 am


EURGBP: Trend and Support & Resistance Analysis
The EURGBP has recently shown notable shifts in its trade patterns, affected by both economic and political factors within the EU and UK. Technical analysis indicates fluctuating momentum, calling for careful assessment of underlying trends. A balance of risks and opportunities exists for traders seeking entry into this currency pair.
Trend Analysis
The trend analysis of the EURGBP reveals intricate dynamics through the evaluated period. Calculating the EMA20 and EMA50 provides deeper characterization:
| Date | Close Price | Trend |
|---|---|---|
| 2026-06-24 | 0.8613 | ▼ |
| 2026-06-23 | 0.86188 | ▼ |
| 2026-06-22 | 0.86244 | ⚖️ |
| 2026-06-21 | 0.86692 | ▲ |
| 2026-06-19 | 0.86553 | ▲ |
| 2026-06-18 | 0.8673 | ▲ |
| 2026-06-17 | 0.86507 | ⚖️ |
The presence of both upward and downward trends over short intervals hints toward mixed market signals, potentially driven by external economic announcements.
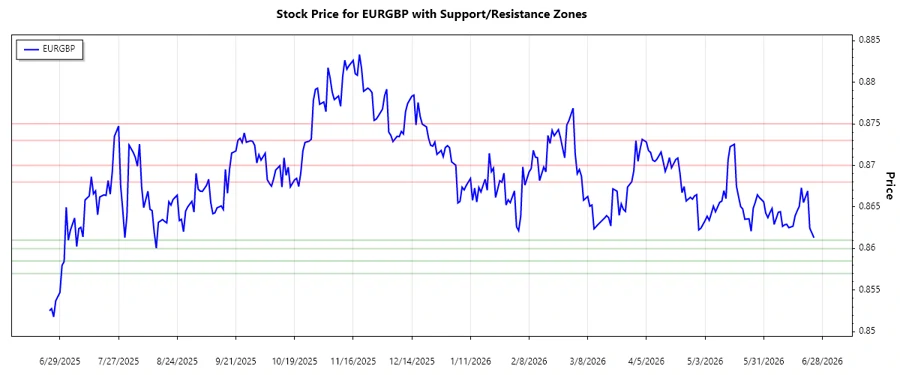
Support- and Resistance
The analysis of support and resistance zones offers critical insights into potential price reactions:
| Zone Type | Level From | Level To | |
|---|---|---|---|
| Support 1 | 0.8600 | 0.8610 | ▼ |
| Support 2 | 0.8570 | 0.8585 | ▼ |
| Resistance 1 | 0.8680 | 0.8700 | ▲ |
| Resistance 2 | 0.8730 | 0.8750 | ▲ |
The current price finds itself near the Support 1 zone, which could act as a pivotal level for upcoming price corrections or rebounds.
Conclusion
Given the current analysis, traders should maintain a cautious outlook on the EURGBP exchange rate, balancing the potential upside opportunities against existing risks. The currency remains poised within critical technical levels, where trends could exhibit volatility contingent upon both global economic events and region-specific developments.
Smart Data Insight
Master the Perfect Entry & Exit for this Stock
Don't leave your profits to chance. Historically, this stock follows specific seasonal patterns that institutional traders use to maximize returns.
- ✅ Identify the "Golden Buying Window"
- ✅ Avoid high-risk correction cycles
- ✅ Backtested data from the last 20+ years