December 28, 2025 a 04:28 am


EURGBP: Trend and Support & Resistance Analysis
The EURGBP currency pair has experienced both upward and downward movements over the recent period, indicating a dynamic market environment. Technical indicators suggest shifts between trends, highlighting both opportunities and potential risks for traders. Monitoring EMA trends and price zones remains crucial for making informed trading decisions.
Trend Analysis
| Date | Close Price | Trend |
|---|---|---|
| 2025-12-26 | 0.87132 | ⚖️ |
| 2025-12-25 | 0.8728 | ▼ |
| 2025-12-24 | 0.87231 | ▼ |
| 2025-12-23 | 0.87241 | ▼ |
| 2025-12-22 | 0.87325 | ▲ |
| 2025-12-21 | 0.87463 | ▲ |
| 2025-12-19 | 0.87495 | ▲ |
Based on the EMAs calculated from recent closing prices, the trend is fluctuating. The short-term EMA20 is currently very close in value to EMA50, suggesting a sideways pattern in the immediate term. However, potential emerging trends can shift market sentiment rapidly.
Support and Resistance
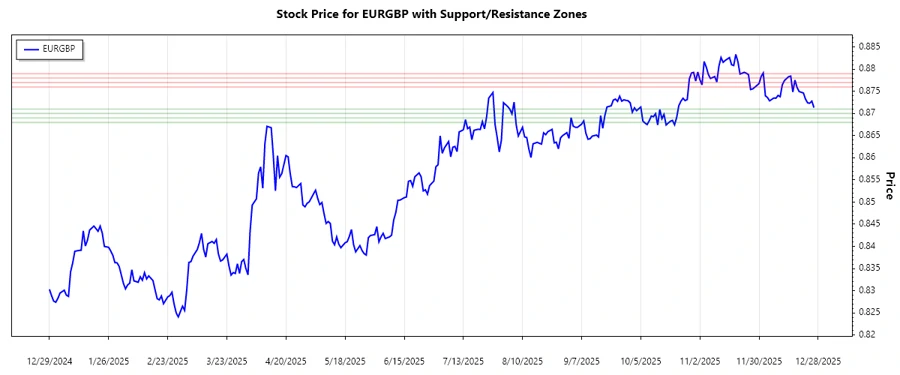
The following table identifies significant support and resistance zones for EURGBP, which are crucial for traders to watch:
| Zone Type | From | To |
|---|---|---|
| Support | 0.87100 | 0.87000 |
| Support | 0.86900 | 0.86800 |
| Resistance | 0.87600 | 0.87700 |
| Resistance | 0.87800 | 0.87900 |
The current closing price of 0.87132 is closely within a support zone, indicating potential for a bounce or continuation depending on market conditions. Assessing the interplay between support and resistance levels will provide opportunities for entry and exit strategies.
Conclusion
EURGBP presents a mixed technical picture with both risks and opportunities. The interplay between the EMAs indicates a balance between bullish and bearish forces, with a recent tendency towards sideways market behavior. The market is currently positioned near support regions, hinting at potential reversals or further declines depending on market catalysts. Vigilant monitoring of support and resistance zones, paired with EMA interpretations, is crucial for navigating this evolving market landscape. Overall, the pair's activity indicates dynamic fluctuations, requiring a disciplined and responsive trading approach.