April 08, 2026 a 05:08 am
EURGBP: Fibonacci Analysis
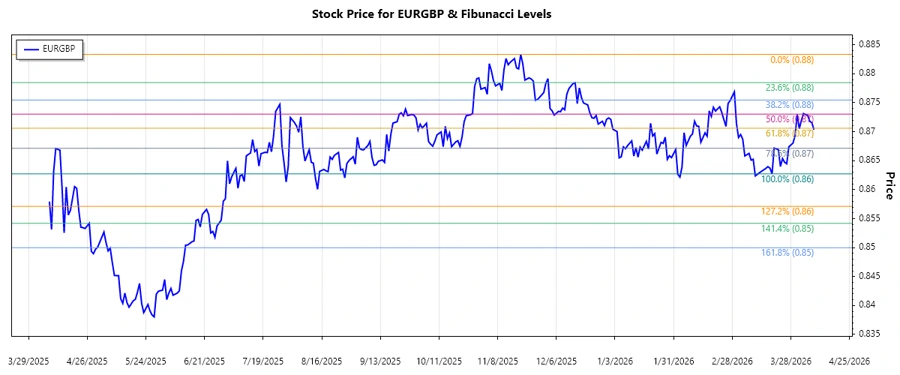
The EURGBP currency pair has been experiencing an observable downward trend since November 2025, with intermittent periods of consolidation. This trend reflects various economic developments affecting both the Euro and the British Pound. Attention to short-term fluctuations is crucial for investors considering the long-term trend direction and potential market reactions.
Fibonacci Analysis
Based on the data provided, a dominant downward trend is identified from November 19, 2025, to April 8, 2026. The high point of 0.88334 was recorded on November 19, 2025, and the low at 0.86272 on March 19, 2026. The following Fibonacci Retracement Levels have been calculated and are detailed in the table below.
| Start Date | End Date | High Price (Date) | Low Price (Date) | Fibonacci Level | Price Level |
|---|---|---|---|---|---|
| 2025-11-19 | 2026-04-08 | 0.88334 (2025-11-19) | 0.86272 (2026-03-19) | 0.236 | 0.87831 |
| 0.382 | 0.87468 | ||||
| 0.5 | 0.87103 | ||||
| 0.618 | 0.86738 | ||||
| 0.786 | 0.86268 |
As of the most recent data, the current price of 0.87033 is between the 0.5 and 0.382 levels, suggesting potential resistance around 0.87103. This technical indicates possible near-term price consolidation before a continuation or reversal of the trend.
The chart above illustrates the retracement levels and their significance in the current price action.
Conclusion
The EURGBP pair's recent movement suggests a continuation of the bearish trend, albeit with short-term resistance observed. As economic indicators continue to influence market conditions, the retracement levels may serve as strategic points for traders. Caution is advised as market dynamics are subject to change with the evolving political landscape and macroeconomic data releases. Analysts should monitor support around the 0.786 level for possible trend reversals.