February 03, 2026 a 05:08 am
EURGBP: Fibonacci Analysis
The EURGBP currency pair has shown notable fluctuations in recent months, exhibiting both challenges and opportunities for traders. With movements impacted by economic indicators, geopolitical developments, and market sentiments, EURGBP remains a key focus for investors looking to capitalize on currency trend potential. Analyzing these dynamics through technical perspectives, such as Fibonacci retracement levels, can provide valuable insights into potential support and resistance zones.
Fibonacci Analysis
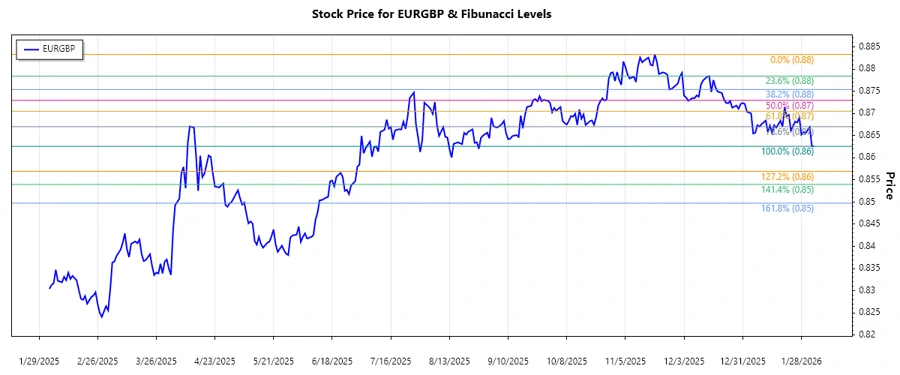
The EURGBP has experienced a notable downtrend over the analyzed period. By identifying the highest and lowest price points within this range, we can calculate the important Fibonacci retracement levels.
| Trend Start Date | Trend End Date | High (Date) | Low (Date) |
|---|---|---|---|
| 2025-11-19 | 2026-02-03 | 0.88334 (2025-11-19) | 0.86258 (2026-02-03) |
| Fibonacci Level | Price Level |
|---|---|
| 23.6% | 0.86743 |
| 38.2% | 0.86988 |
| 50.0% | 0.87296 |
| 61.8% | 0.87604 |
| 78.6% | 0.88043 |
The current price is at 0.86258, which is below the 0.236 retracement level. This indicates that the price is not currently within a primary retracement zone. In technical terms, significant support has not yet been breached, suggesting that the price may stabilize or further test lower support levels.
Conclusion
The EURGBP's downtrend presents both opportunities and risks for traders. While the pair is currently trading below its 23.6% Fibonacci retracement level, indicating potential for further decline, it also provides an opportunity for reversal trades should support levels hold. Market participants should closely monitor economic indicators and geopolitical events that could influence currency movement. Overall, understanding Fibonacci levels helps in identifying key zones where price action is likely to react, offering potential strategies for informed decision-making.