December 02, 2025 a 05:08 am

EURGBP: Fibonacci Analysis
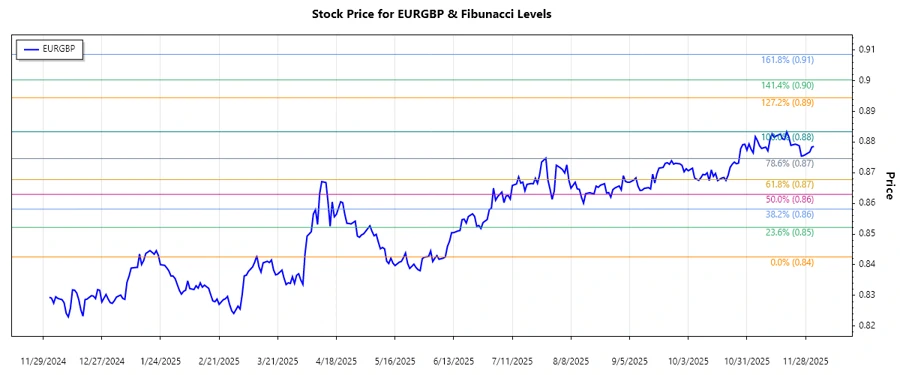
The EURGBP has exhibited a notable upward trend over the past few months, indicating a recovery in the Euro against the British Pound. The analysis of Fibonacci retracement levels will provide insights into potential support and resistance areas, crucial for future trading strategies. Market participants should be attentive to these levels to make informed decisions.
Fibonacci Analysis
| Metric | Details |
|---|---|
| Trend Start Date | 2025-06-09 |
| Trend End Date | 2025-11-19 |
| High Point (Price/Date) | 0.88334 / 2025-11-19 |
| Low Point (Price/Date) | 0.84252 / 2025-06-09 |
| Fibonacci Levels |
|
| Current Price and Zone | 0.87856 - Between 0.618 and 0.786 |
| Technical Interpretation | Price is approaching major resistance levels between the 0.618 and 0.786 retracement zones, indicating potential selling pressure. |
Conclusion
The EURGBP is currently in a notable uptrend, with the Fibonacci analysis indicating that the currency pair is approaching key retracement levels that could serve as resistance. Analysts should monitor these levels closely, as a break above the 0.786 level would suggest continued strength in the Euro. Conversely, failure to break through could lead to a consolidation or correction. The overall analysis suggests that while there is potential for further gains, risks remain contingent on the resistance holding.
Smart Data Insight
Master the Perfect Entry & Exit for this Stock
Don't leave your profits to chance. Historically, this stock follows specific seasonal patterns that institutional traders use to maximize returns.
- ✅ Identify the "Golden Buying Window"
- ✅ Avoid high-risk correction cycles
- ✅ Backtested data from the last 20+ years