September 30, 2025 a 05:08 am
EURGBP: Fibonacci Analysis
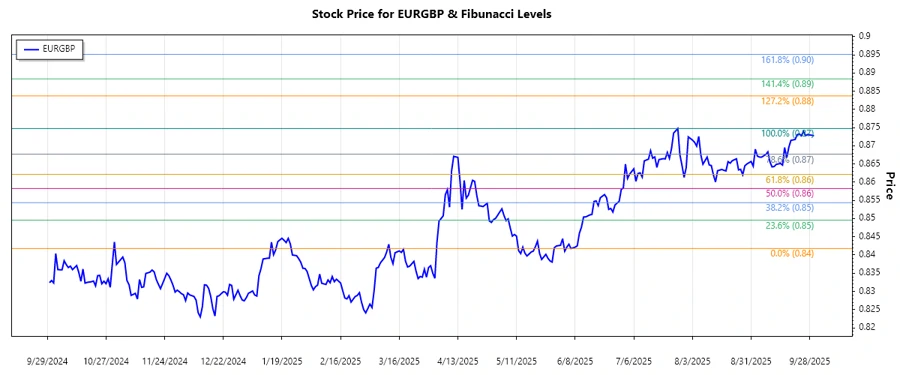
The EURGBP currency pair has shown a consistent upward trend over the past few months, reflecting strengthening market sentiment. As economic variables between the Eurozone and the UK fluctuate, this pair remains susceptible to changes in economic policies and market expectations. Technical analysis indicates potential key levels based on recent price movements, serving as potential indicators for future market behavior.
Fibonacci Analysis
| Detail | Information |
|---|---|
| Start Date | 2025-06-08 |
| End Date | 2025-09-30 |
| High Point | 0.87473 on 2025-07-27 |
| Low Point | 0.84177 on 2025-06-08 |
| Fibonacci Level | Price |
|---|---|
| 0.236 | 0.85056 |
| 0.382 | 0.85663 |
| 0.5 | 0.86064 |
| 0.618 | 0.86465 |
| 0.786 | 0.86982 |
As of the current price at 0.87273, it lies above the 0.786 Fibonacci level, indicating potential resistance in the upward trend.
Technically, this suggests stronger bearish retracement potential, with the 0.786 level acting as a significant resistance point unless the price breaks upward convincingly.
Conclusion
In conclusion, while the short-term movement of the EURGBP indicates an upward trend, the current level suggests caution as prices test a key resistance. The potential for a stronger retracement exists if resistance levels are not breached, thus presenting a risk for bullish positions. Strategically, a breakout above current levels could signal further buying opportunities. However, the inability to maintain above 0.86982 could attract bearish sentiment and selling pressure. Analysts should remain vigilant for economic cues from Eurozone and UK markets, which may impact these technical levels.
Smart Data Insight
Master the Perfect Entry & Exit for this Stock
Don't leave your profits to chance. Historically, this stock follows specific seasonal patterns that institutional traders use to maximize returns.
- ✅ Identify the "Golden Buying Window"
- ✅ Avoid high-risk correction cycles
- ✅ Backtested data from the last 20+ years