September 14, 2025 a 05:08 am## EURGBP: Fibonacci Analysis
 ## Fibonacci Analysis
Based on the data provided, we have assessed the recent downtrend in the EURGBP currency pair.
### Trend Analysis Table
## Fibonacci Analysis
Based on the data provided, we have assessed the recent downtrend in the EURGBP currency pair.
### Trend Analysis Table
### Fibonacci Retracement Levels Table
### Current Retracement Analysis
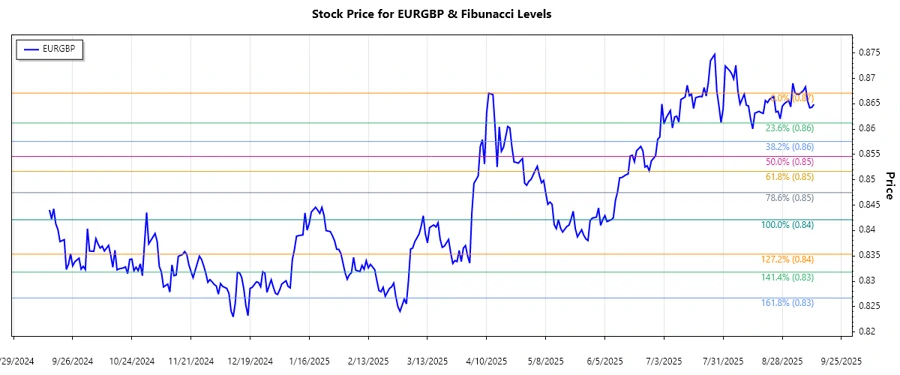
As of the latest data point, the current price of EURGBP is 0.86489, which places it in the 0.786 retracement zone. This is indicative of a strong resistance level, and it suggests that in the short term, the currency pair might face difficulty surpassing this level without significant market catalysts.
 ## Conclusion
In summary, the EURGBP has experienced a prominent downtrend over the preceding months. While recent levels suggest a potential area of resistance, breaking beyond the 0.786 Fibonacci level might signal a potential trend reversal. Traders should remain cautious and closely observe economic news that could drive currency fluctuations. This analysis highlights the importance of continuous monitoring and potential risk management strategies in forex trading.
## Conclusion
In summary, the EURGBP has experienced a prominent downtrend over the preceding months. While recent levels suggest a potential area of resistance, breaking beyond the 0.786 Fibonacci level might signal a potential trend reversal. Traders should remain cautious and closely observe economic news that could drive currency fluctuations. This analysis highlights the importance of continuous monitoring and potential risk management strategies in forex trading.
The EURGBP currency pair has recently demonstrated a declining trend over the past few months. This consistent downtrend suggests underlying bearish market sentiment. By examining these shifts, we can achieve a deeper understanding of investor sentiment and potential future movements in the market.
| Description | Details |
|---|---|
| Start Date | 2024-09-15 |
| End Date | 2025-09-12 |
| High Point (Price) | 0.8671 (2025-04-11) |
| Low Point (Price) | 0.84214 (2025-06-08) |
| Level | Price |
|---|---|
| 0.236 | 0.8501 |
| 0.382 | 0.8538 |
| 0.5 | 0.8576 |
| 0.618 | 0.8614 |
| 0.786 | 0.8662 |
## Conclusion
In summary, the EURGBP has experienced a prominent downtrend over the preceding months. While recent levels suggest a potential area of resistance, breaking beyond the 0.786 Fibonacci level might signal a potential trend reversal. Traders should remain cautious and closely observe economic news that could drive currency fluctuations. This analysis highlights the importance of continuous monitoring and potential risk management strategies in forex trading.
Smart Data Insight
Master the Perfect Entry & Exit for this Stock
Don't leave your profits to chance. Historically, this stock follows specific seasonal patterns that institutional traders use to maximize returns.
- ✅ Identify the "Golden Buying Window"
- ✅ Avoid high-risk correction cycles
- ✅ Backtested data from the last 20+ years