
June 19, 2026 a 04:28 am
EURCHF: Trend and Support & Resistance Analysis
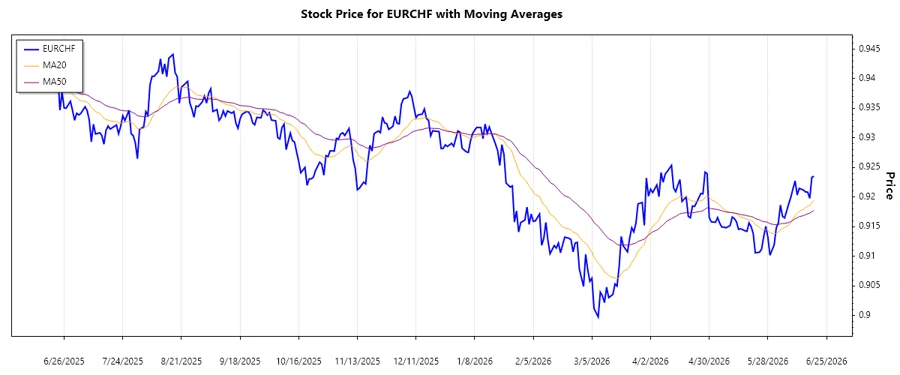
The EURCHF currency pair has shown a steady performance over the past months with fluctuations in trends. Recently, the pair has demonstrated signs of an upward consolidation, indicating potential bullish momentum. Technical indicators suggest the possibility of a continued trend, but traders should remain vigilant for market shifts. Understanding key support and resistance levels can assist traders in making informed decisions in this evolving market.
Trend Analysis
| Date | Close Price | Trend |
|---|---|---|
| 2026-06-19 | 0.92352 | ▲ EMA20 > EMA50 |
| 2026-06-18 | 0.92334 | ▲ EMA20 > EMA50 |
| 2026-06-17 | 0.91979 | ▲ EMA20 > EMA50 |
| 2026-06-16 | 0.92083 | ▲ EMA20 > EMA50 |
| 2026-06-15 | 0.92085 | ▲ EMA20 > EMA50 |
| 2026-06-14 | 0.92117 | ▲ EMA20 > EMA50 |
| 2026-06-12 | 0.92147 | ▲ EMA20 > EMA50 |
Notable upward trend with EMA20 consistently above EMA50, signaling ongoing bullish momentum. Such conditions often precede sustained price growth, which may be strategically advantageous for long positions.
Support- and Resistance
| Zone | From | To | Status |
|---|---|---|---|
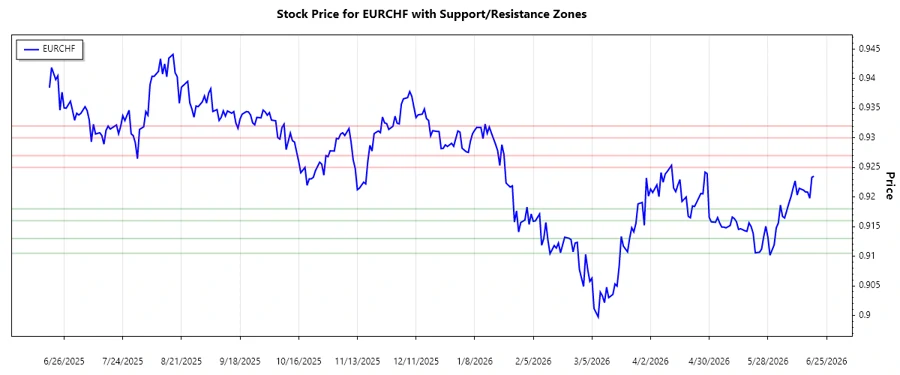
| Support Zone 1 | 0.9105 | 0.9130 | ⬇️ Below Current |
| Support Zone 2 | 0.9160 | 0.9180 | ⬇️ Below Current |
| Resistance Zone 1 | 0.9250 | 0.9270 | ⬆️ Above Current |
| Resistance Zone 2 | 0.9300 | 0.9320 | ⬆️ Above Current |
The current price is approaching the first resistance zone. This proximity may lead to a test of upper boundaries, potentially offering breakout opportunities if continued upward momentum materializes.
Conclusion
The EURCHF pair is exhibiting a steady upward trend backed by technical indicators, suggesting bullish prospects in the near term. Key support levels provide a safety net for potential pullbacks, while resistance zones identify potential breakout points. Traders could find opportunities in observing these levels for strategic entries or exits. While current trends favor upward movement, unexpected economic changes or geopolitical events could shift dynamics, underscoring the need to remain adaptable.
Smart Data Insight
Master the Perfect Entry & Exit for this Stock
Don't leave your profits to chance. Historically, this stock follows specific seasonal patterns that institutional traders use to maximize returns.
- ✅ Identify the "Golden Buying Window"
- ✅ Avoid high-risk correction cycles
- ✅ Backtested data from the last 20+ years