July 13, 2025 a 04:28 am


EURCHF: Trend and Support & Resistance Analysis
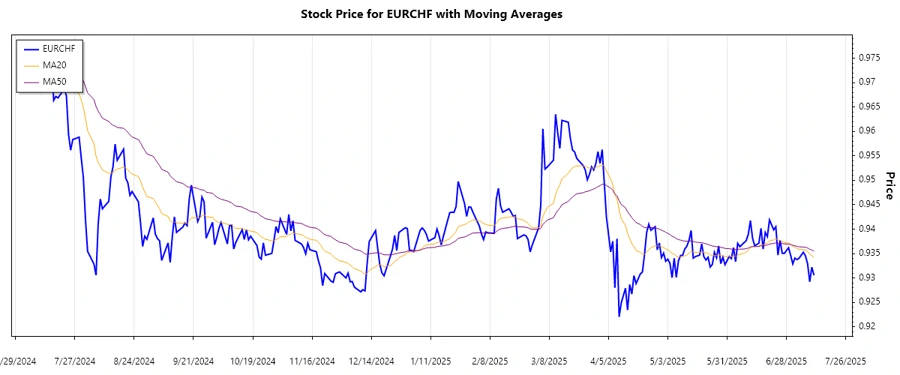
The EURCHF currency pair has experienced noticeable fluctuations in recent months, indicating various market sentiments. With a detailed analysis of historic price data, we identify the prevailing trends and important support and resistance zones. This provides clear insights into potential future movements and necessary market action.
Trend Analysis
| Date | Closing Price | Trend |
|---|---|---|
| 2025-07-11 | 0.93055 | ▼ Down |
| 2025-07-10 | 0.93220 | ▼ Down |
| 2025-07-09 | 0.92923 | ▼ Down |
| 2025-07-08 | 0.93290 | ▼ Down |
| 2025-07-07 | 0.93450 | ▼ Down |
| 2025-07-06 | 0.93527 | ▁ Sideways |
| 2025-07-04 | 0.93405 | ▁ Sideways |
The trend analysis indicates a recent downward movement with temporary sideways trends. The EMA calculations reflect a bearish sentiment as EMA20 is below EMA50.
Support and Resistance
| Zone | From | To | Direction |
|---|---|---|---|
| Support 1 | 0.92900 | 0.93000 | ⬇ Decreasing |
| Support 2 | 0.92650 | 0.92750 | ⬇ Decreasing |
| Resistance 1 | 0.93700 | 0.93800 | ⬆ Increasing |
| Resistance 2 | 0.94000 | 0.94100 | ⬆ Increasing |
The current price rests within the first support zone, which could suggest potential buying interest at this level. However, upcoming resistance levels may challenge any upward movements, maintaining bearish pressure.
Conclusion
The technical analysis of EURCHF reveals a predominant downward trend with crucial support and resistance zones. Current levels suggest bearish pressure but also present opportunities for potential rebounds from support zones. Volatility remains a significant factor, providing both risk and potential profit opportunities for traders. Analysts should consider the broader economic conditions affecting the Euro and Swiss Franc while strategizing their positions.
Smart Data Insight
Master the Perfect Entry & Exit for this Stock
Don't leave your profits to chance. Historically, this stock follows specific seasonal patterns that institutional traders use to maximize returns.
- ✅ Identify the "Golden Buying Window"
- ✅ Avoid high-risk correction cycles
- ✅ Backtested data from the last 20+ years