
July 20, 2026 a 05:08 am
EURCHF: Fibonacci Analysis
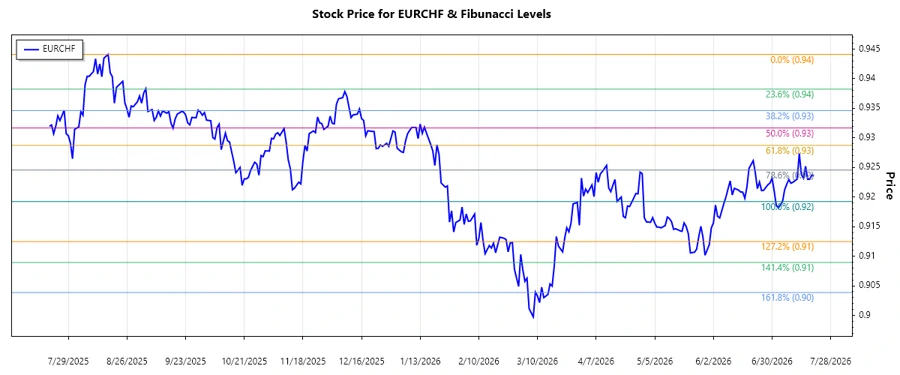
The EUR/CHF currency pair has shown a recent downturn, with prices consistently dropping over a few months. The pair's performance is influenced by economic indicators, political stability, and differing monetary policies between the Eurozone and Switzerland. A technical analysis is necessary to identify potential levels of support or resistance within this declining trend.
Fibonacci Analysis
A detailed analysis of the EUR/CHF pair shows that a strong downward trend emerged over the past months. The highest price was recorded on August 17, 2025, at 0.94411, while the lowest point was observed on July 5, 2026, at 0.91923. Based on these levels, Fibonacci retracement levels have been calculated.
| Trend Analysis | Details |
|---|---|
| Trend Start Date | August 17, 2025 |
| Trend End Date | July 5, 2026 |
| High | 0.94411 (August 17, 2025) |
| Low | 0.91923 (July 5, 2026) |
| Fibonacci Levels |
|
| Current Price Position | The current price of 0.92358 is within the 0.236 retracement zone. |
| Technical Interpretation | This zone may serve as a resistance, indicating potential short-term recovery unless a decisive break above occurs. |
Conclusion
The EUR/CHF currency pair, currently within a retracement zone, suggests a cautiously optimistic outlook for traders seeking short-term profits. While the 0.236 Fibonacci level presents an initial resistance, a breakthrough could herald renewed upward momentum. Conversely, failure to maintain current levels may see the pair revert to its downward trajectory. Long-term analysts should remain mindful of broader macroeconomic factors impacting the pair, while short-term traders can exploit retracement opportunities.
Smart Data Insight
Master the Perfect Entry & Exit for this Stock
Don't leave your profits to chance. Historically, this stock follows specific seasonal patterns that institutional traders use to maximize returns.
- ✅ Identify the "Golden Buying Window"
- ✅ Avoid high-risk correction cycles
- ✅ Backtested data from the last 20+ years